


Intermediate – STOCHASTIC OSCILLATOR (Stochastic)

STOCHASTIC OSCILLATOR (Stochastic)
![]()
(A) Introduction
▸A momentum indicator used to
identify when an instrument is currently overbought
or oversold
▸It is easy & simple to
understand with a high degree of accuracy in signaling when to enter the market.
▸It is used to measure the
degree of change between an instrument’s closing price and its price range over a period of time.
▸Displayed as an oscillator
(line graph), scaled from 0 to 100.
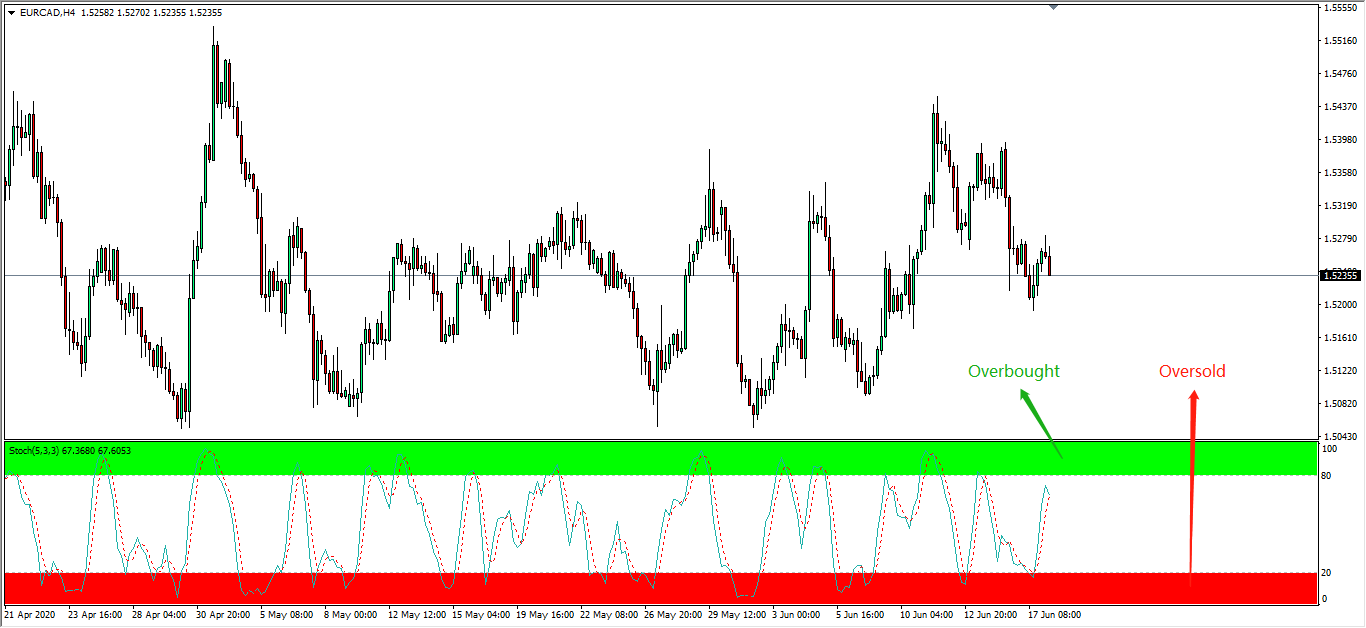
1) 80-100 : Indicates an overbought
market
2) 0-20 : Indicates an
oversold market
![]()
(B) Overview
![]()
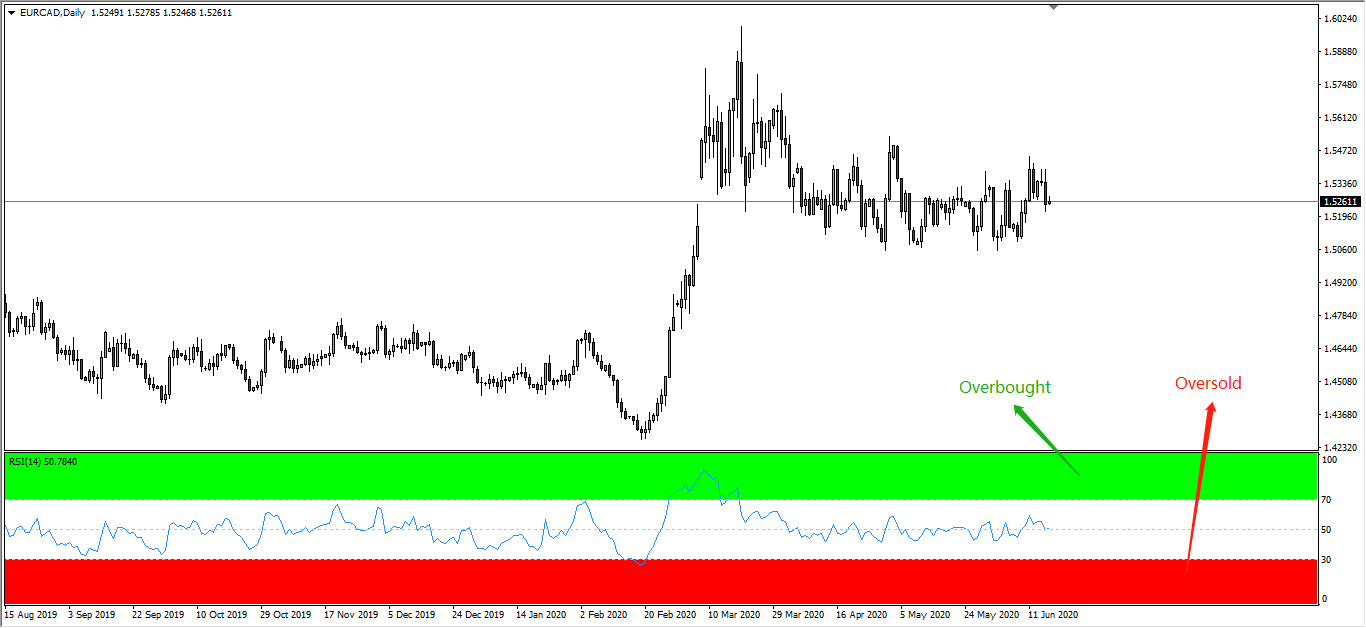
(C) Application Of Stochastic
▸The application for Stochastic
is somewhat similar to the Relative Strength Index (RSI); Investors normally combine both indicators together
to obtain the same signal.
▸The concept applies the famous
saying of ‘Buy Low , Sell High’
▸Investors will sell when the
Stochastic lines are above 80; while buy when the lines are below 20.
▸One thing to note about the
Stochastic is that the lines may stay around the overbought & oversold levels for a long period of time;
Investors are advised to closely
monitor price actions for any breakout confirmation before trading with Stochastic signals.
![]()

Follow Regain capital


latest articles
-
- Jun 18,2020
-
- Jun 17,2020
-
- Jun 15,2020
-
- Feb 06,2020
-
- Jan 06,2020
-
- Jan 03,2020


Risk Warning:
The trading products provided by Regain Capital include currency pairs,
precious metals, crude oil, etc., all can be considered to carry high risks. Your investment
can increase as well as decrease in value and ultimately you may lose some or all of your
deposits. Margin trading may not be suitable for everyone. Please confirm that you are fully
aware of the risks involved before trading. Please note: any information provided by Regain
Capital is not investing advice.
Top Wealth Trading Limited is registered under Canada’s Money Service Business and Topical Wealth International Limited, authorised and regulated by the Seychelles Financial Service Authority (FSA), are members of Top Wealth Group. Regain Capital is authorised by Top Wealth Group to operate under regulatory supervision in various geographical locations across the globe.


CopyRight © 2021 regaincapital.com All Rights Reserved


