


Intermediate – Trendline

Trendlines can be used to identify and confirm trends. A trendline connects at least 2 price points on a chart and is usually extended forward to identify sloped areas of support and resistance. Lines with a positive slope that support price action show that net-demand is increasing. If the price action stays above this line, we have a bullish trend. Conversely, lines with a negative slope that act as resistance to the price action show that net-supply is increasing. If the price action stays under this line, we have a bearish trend.
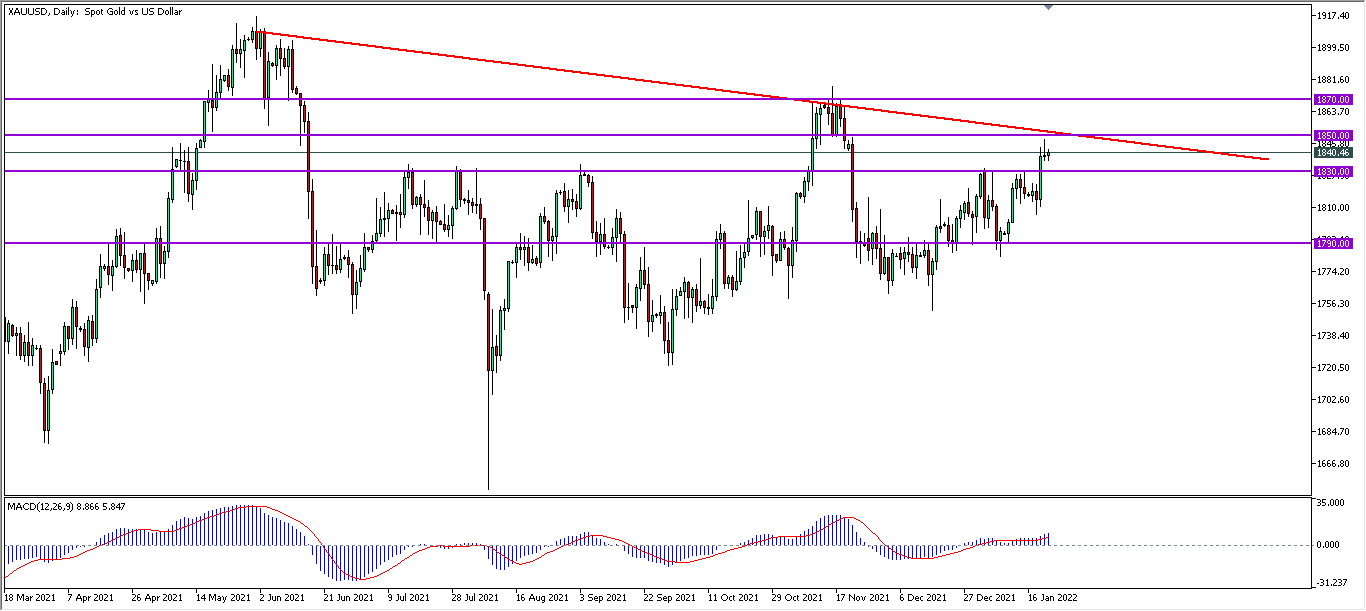
Price usually retests a sloped trend line several times, until it breaks at which point, we may have a trend reversal. The more points there are to connect, the stronger a trend line becomes. Different strategies have different rules on how far apart connected price points can be and whether to connect wicks or candle bodies, but all trend lines break eventually.
How to use trendlines in your trading?
A key part of delving into technical analysis and trading off charts, trendlines make an excellent tool for traders—if they’re used correctly. Used improperly though, they become ineffective and even counterproductive.
This might result in the false belief that prices have made a reversal or that a trend has strength when price action suggests it doesn’t. The following tips can help you effectively use trendlines as part of your trading strategy.
The Basics of the Tool
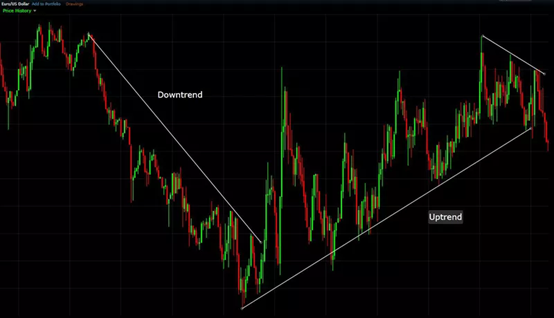
A trendline connects a swing low to a swing high, from the lowest point of the downward movement to the highest point in the upward movement. When the price rises, the trend line rises accordingly.
Connecting these lows with a line results in an ascending trendline, showing you that the prices are trending upwards. A trendline can also be drawn along the individual swing highs. This shows the angle of ascent, the strength of the price move, and the relative strength of the trend.
When the price falls, the swing highs fall. Connecting these highs with a line results in a descending trendline, illustrating the downward trend. A trendline can also be drawn along the swing lows. This shows the angle of descent and the strength of the downward price movement.
Multiple Trendlines
Typically, you would have more than just one trendline in play. At any given moment you could draw many trendlines, all showing the price movement over various periods of time.
Trendlines at very steep angles typically have a short life, since prices cannot sustain a near-vertical rise or fall for long.
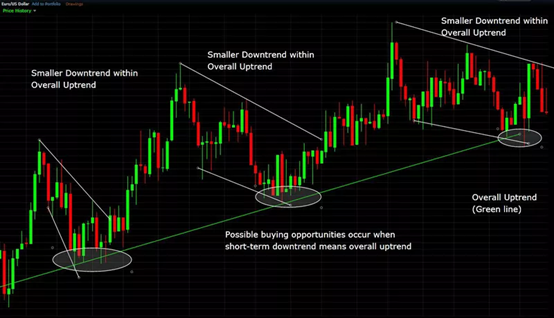
That said, drawing trendlines whenever possible can aid new traders in spotting the overall trend, while also highlighting small trends and corrections within that overall trend.
During an uptrend, buying or going long opportunities may occur when a short-term downtrend meets the overall ascending trendline. During a downtrend, selling or shorting opportunities may occur when a short-term uptrend meets the overall descending trendline.
Adjusting Trendlines
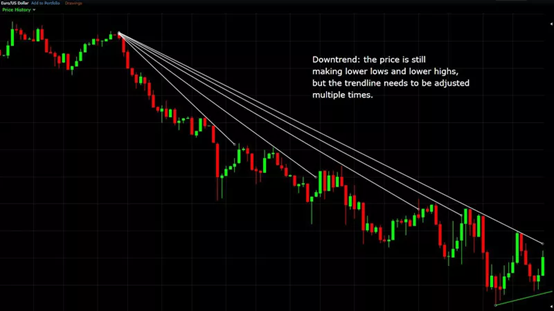
Once drawn, trendlines often need to be adjusted. Prices don’t usually move in a uniform fashion, and since trendlines account for both time and price, they move along the price and time axis.
This means that any acceleration or deceleration of the trend requires adjustments to the trendline. Trendlines work as a tool and can’t be relied on solely. To decide whether a trendline should be adjusted, or whether it has been broken, consider how the price moves within a trend.
During an uptrend (downtrend), the price makes higher (lower) highs and higher (lower) lows. If the price moves below (above) the trendline, it doesn’t necessarily mean the trend has ended, just that the line may need some adjustments.
Trendlines as a Guide
The need for constant adjusting makes a trendline imprecise for use as a trading signal. Also, consider that a trendline drawn at a slightly different angle can make a big difference in what price that trendline intersects with.
Therefore, while you can use trendlines as a guide, use more precise criteria for entering a trade, such as a move back in the trending direction, an engulfing pattern (where the next bar is larger than the previous one, engulfing it), or an indicator that adjusts more precisely and quickly to changes in volatility.
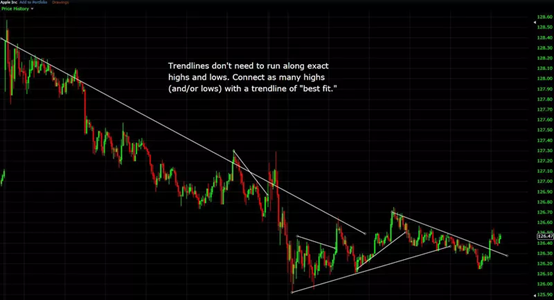
If you use trendlines as just a guide, then you don’t need to worry about drawing trendlines along the exact highs or lows. Draw “trendlines of best fit.” The best fit trendlines still provide you with a visual trend and alert you to potential trade areas.
In some cases, drawing trendlines along extreme highs and lows works, but when it doesn’t, draw trendlines of best fit. Since the trendline isn’t being used as a trade signal, it still provides you with relevant information about the trend, without the need to constantly readjust it.
Summary
Trendlines are a great tool, showcasing short-term trends within the overall trend. Pay attention to price action and always consider it when using trendlines. If the price makes higher lows and lower highs, it’s still a downtrend even if the price moves above a descending trendline; vice-verse.
A trendline needs to be adjusted often, especially when day trading. Use “trendlines of best fit” to avoid constant adjustments. The trendline of best fit still shows the trend and when the trend may be reversing.
Use trendlines to alert you of potential trade opportunities, and use price action signals (acting on trades simply by the price) to get in. Remember, TREND IS YOUR FRIEND

Follow Regain capital


latest articles
-
- Mar 11,2022
-
- Jan 25,2022

-
- Jan 25,2022

-
- Jan 24,2022

-
- Jan 17,2022
-
- Jan 17,2022


Risk Warning:
The trading products provided by Regain Capital include currency pairs,
precious metals, crude oil, etc., all can be considered to carry high risks. Your investment
can increase as well as decrease in value and ultimately you may lose some or all of your
deposits. Margin trading may not be suitable for everyone. Please confirm that you are fully
aware of the risks involved before trading. Please note: any information provided by Regain
Capital is not investing advice.
Top Wealth Trading Limited is registered under Canada’s Money Service Business and Topical Wealth International Limited, authorised and regulated by the Seychelles Financial Service Authority (FSA), are members of Top Wealth Group. Regain Capital is authorised by Top Wealth Group to operate under regulatory supervision in various geographical locations across the globe.


CopyRight © 2021 regaincapital.com All Rights Reserved


