


- Beginner Level
- Intermediate Level
- Advanced Level
- Additional Reading
Intermediate – STOCHASTIC OSCILLATOR (Stochastic)
Jun 18,2020
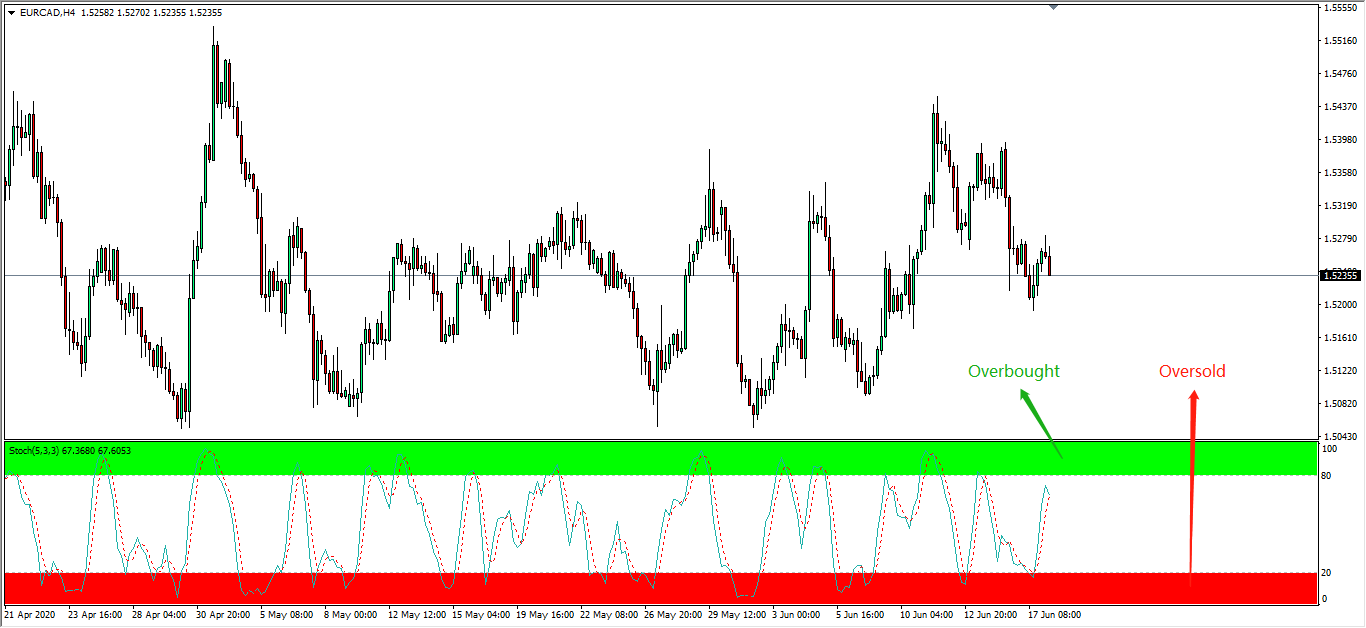
STOCHASTIC OSCILLATOR (Stochastic) (A) Introduction ▸A momentum indicator used to identify when an instrument is currently overbought or oversold ▸It is easy & simple to understand with a high degree of accuracy in signaling when to enter the market. ▸It is used to measure the degree of change between an instrument’s......
Intermediate – RELATIVE STRENGTH INDEX (RSI)
Jun 17,2020
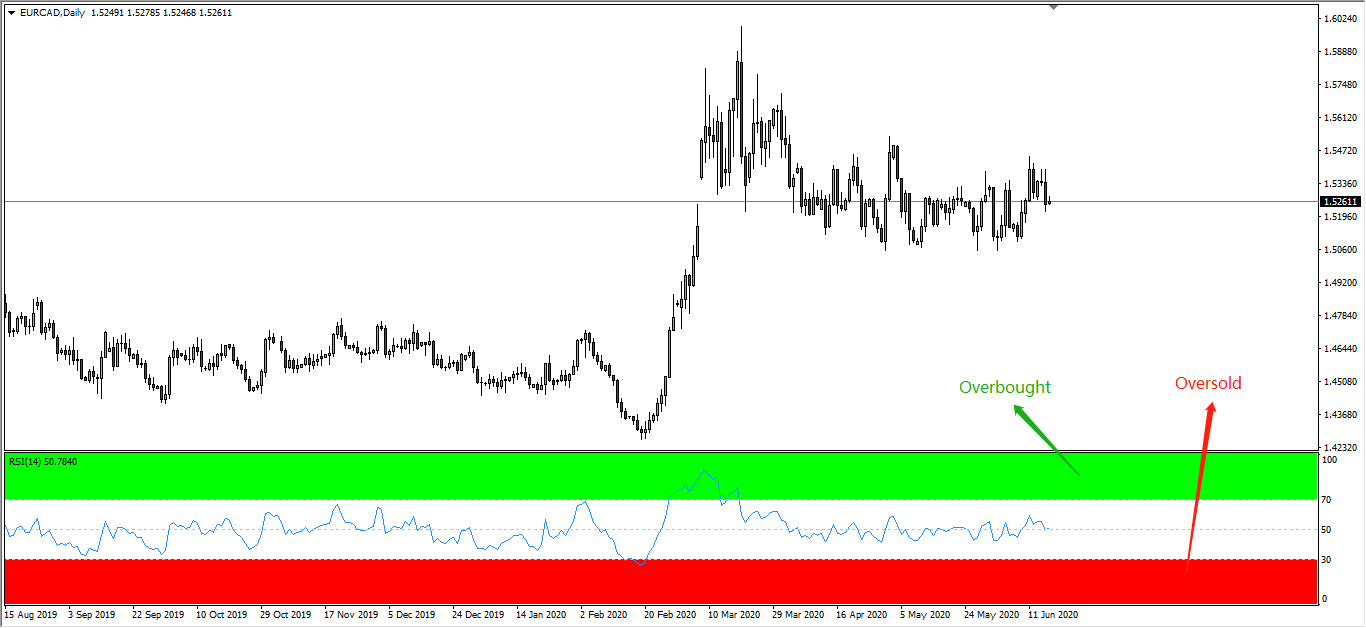
RELATIVE STRENGTH INDEX (RSI) (A) Introduction ▸A momentum indicator used to measure the extent of price changes of an instrument. ▸It is mainly used to identify when an instrument is currently overbought or oversold following an existing trend. ▸Also used to identify potential trend reversal ▸Displayed as an oscillator (line graph),......
Intermediate – BOLLINGER BANDS (BB)
Jun 15,2020
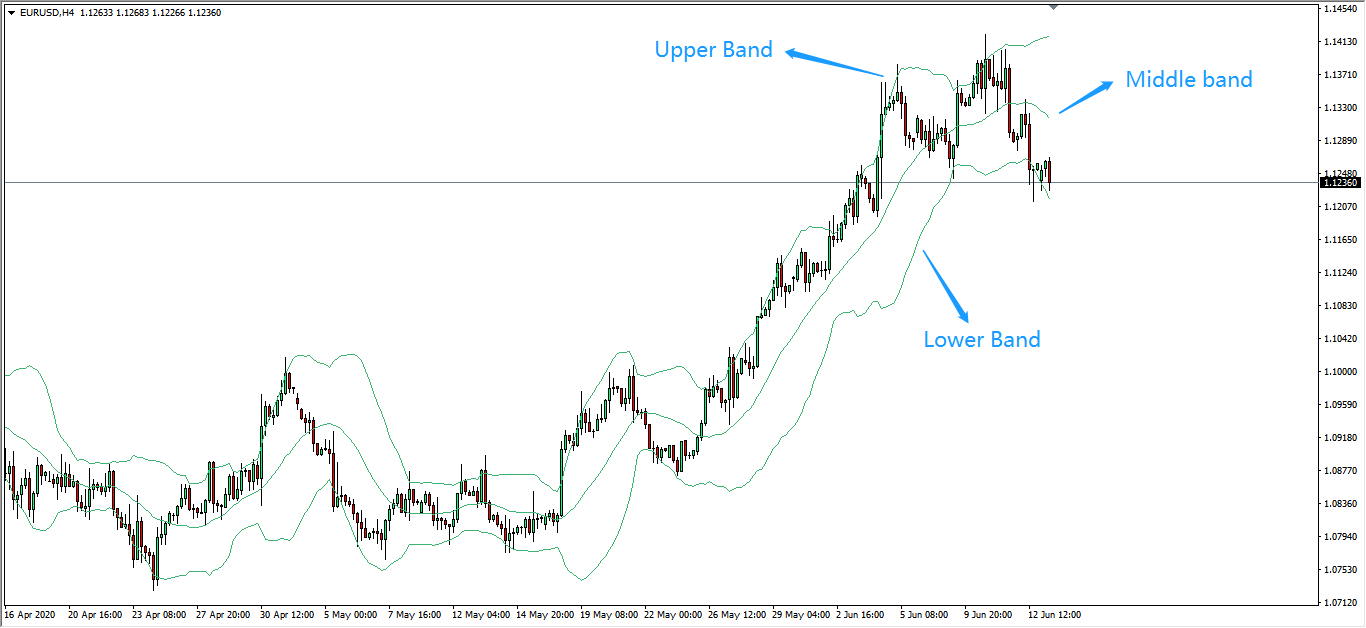
BOLLINGER BANDS (BB) (A) Introduction ▸A technical indicator used to measure the volatility of the market and/or instrument. ▸It is also used to identify when an instrument is currently overbought or oversold. ▸Composed from three bands (lines): 1) Middle band : A simple moving average (SMA) by default of 20......
Intermediate – Trendline
Feb 06,2020
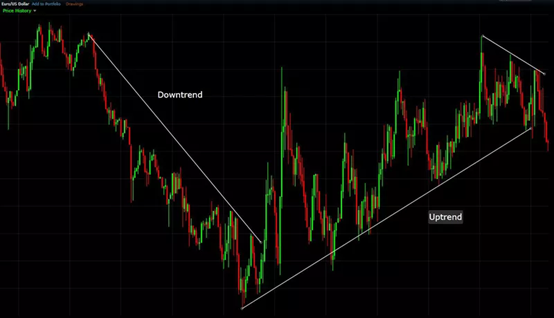
Trendlines can be used to identify and confirm trends. A trendline connects at least 2 price points on a chart and is usually extended forward to identify sloped areas of support and resistance. Lines with a positive slope that support price action show that net-demand is increasing. If the price......
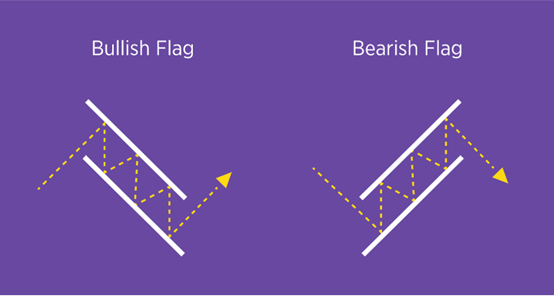
Intermediate – Bullish and Bearish Flags
Jan 06,2020
What are Bullish and Bearish Flags? Bullish flags formations occur when the slope of the channel connecting lower highs and lower lows of consolidating prices following a significant move up is parallel and declining. The trend before the flag must be up. Bearish flags formations occur when the slope of......
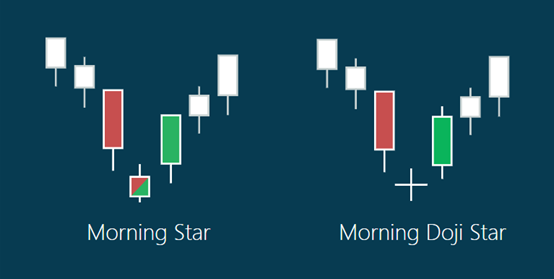
Intermediate – Morning Star
Jan 03,2020
What is a Morning Star? A bullish three period candlestick formation that consists of: ➟A long red candle followed by: ➟➟a small red or green candle (or doji) that gaps below the close of the previous candle followed by; ➟➟➟a long green candle (stronger signal if gaps up) This is......

Follow Regain capital


latest articles
-
- Jun 18,2020

-
- Jun 17,2020

-
- Jun 15,2020

-
- Feb 06,2020

-
- Jan 06,2020

-
- Jan 03,2020


Risk Warning:
The trading products provided by Regain Capital include currency pairs,
precious metals, crude oil, etc., all can be considered to carry high risks. Your investment
can increase as well as decrease in value and ultimately you may lose some or all of your
deposits. Margin trading may not be suitable for everyone. Please confirm that you are fully
aware of the risks involved before trading. Please note: any information provided by Regain
Capital is not investing advice.
Top Wealth Trading Limited is registered under Canada’s Money Service Business and Topical Wealth International Limited, authorised and regulated by the Seychelles Financial Service Authority (FSA), are members of Top Wealth Group. Regain Capital is authorised by Top Wealth Group to operate under regulatory supervision in various geographical locations across the globe.


CopyRight © 2021 regaincapital.com All Rights Reserved


