


Intermediate – BOLLINGER BANDS (BB)

BOLLINGER BANDS (BB)
![]()
(A) Introduction
▸A technical indicator used to
measure the volatility of the market and/or instrument.
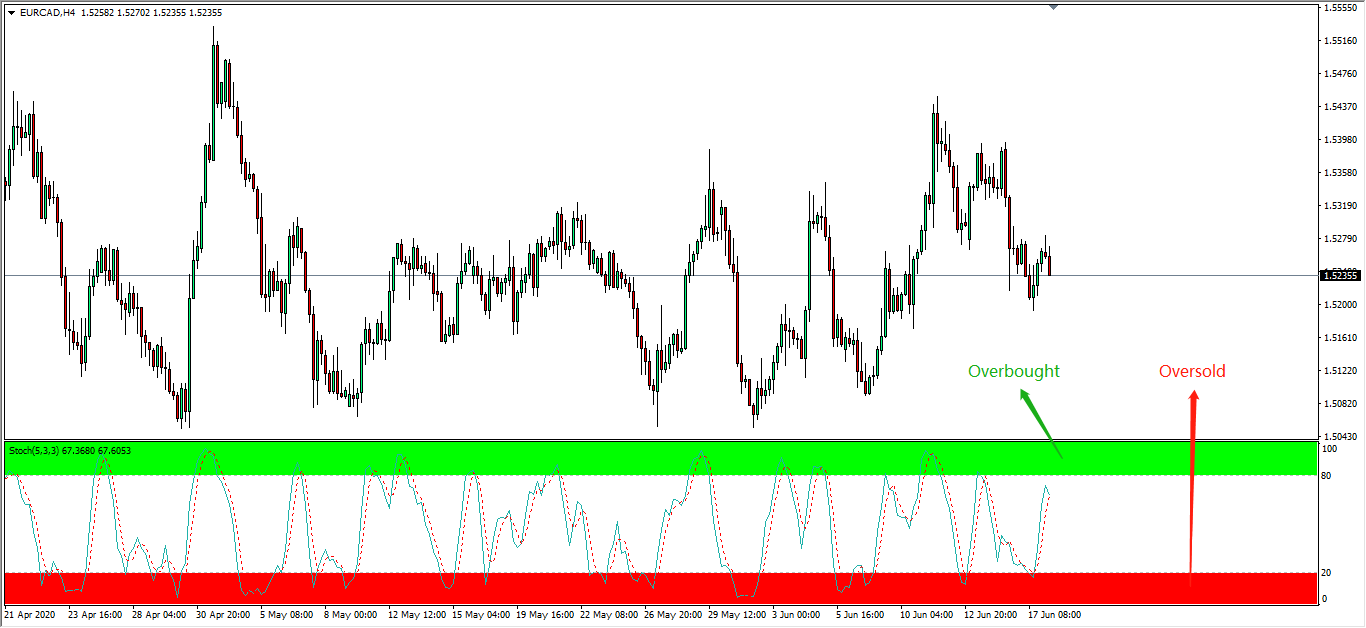
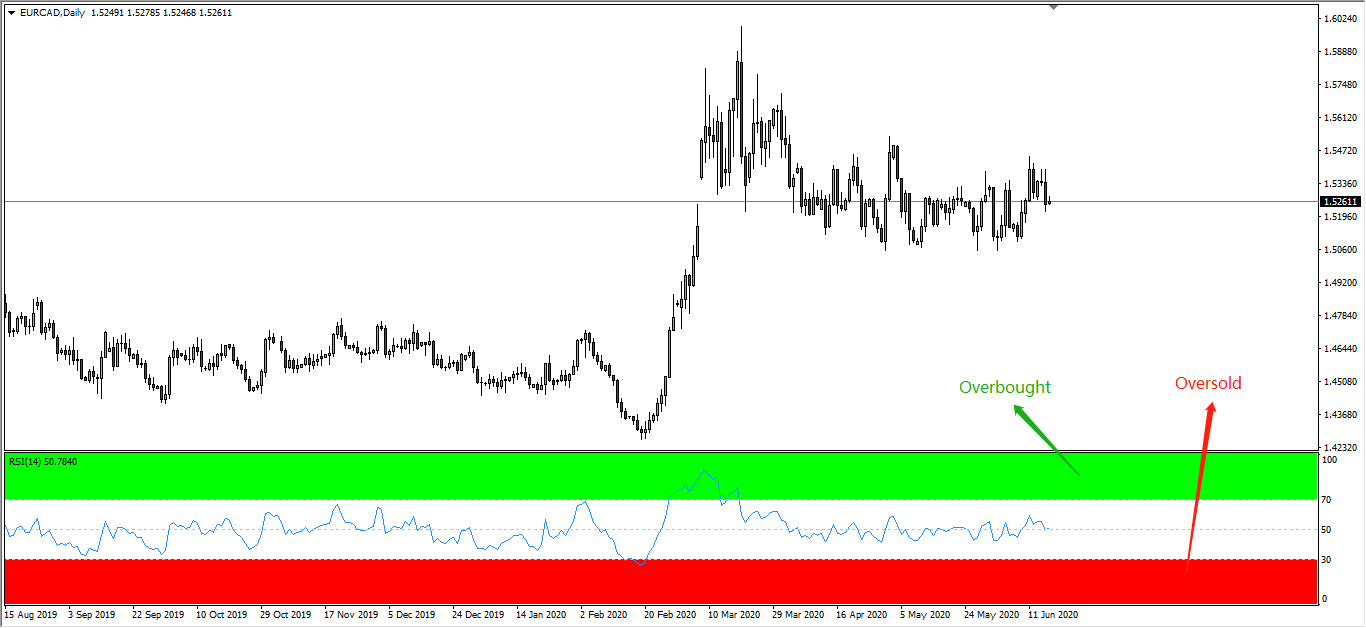
▸It is also used to identify
when an instrument is currently overbought or oversold.
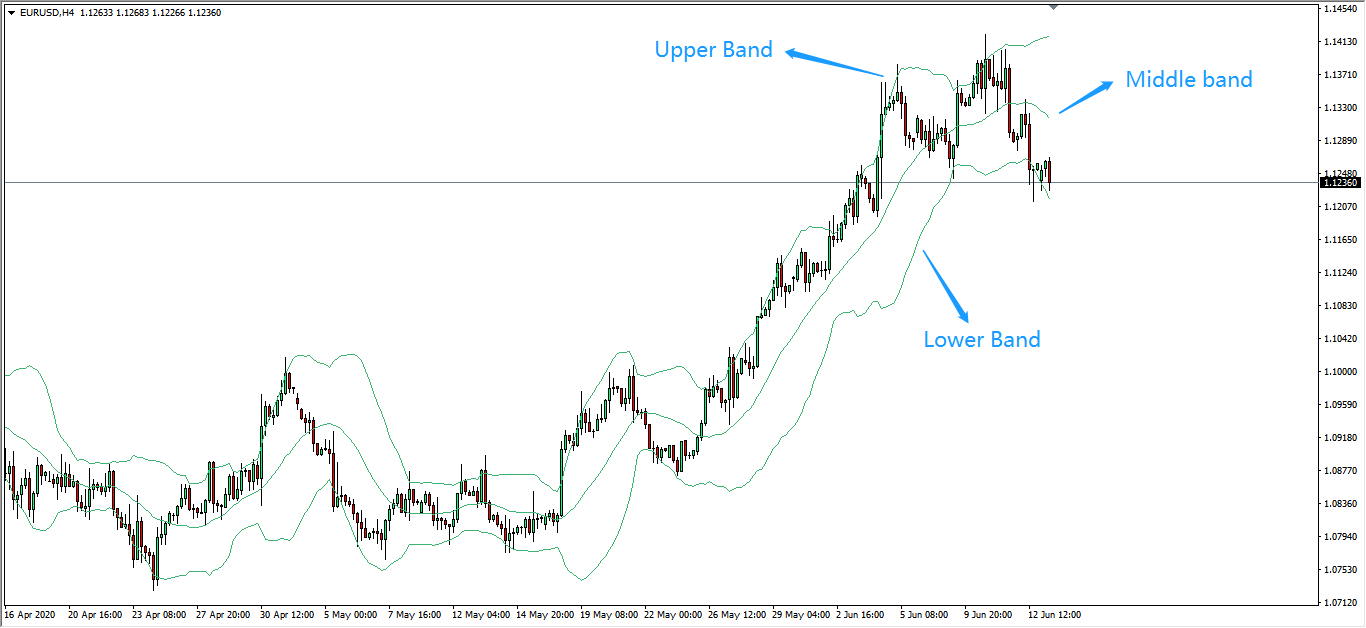
▸Composed from three bands
(lines):
1) Middle band : A simple moving
average (SMA) by default of 20 periods (20-SMA)
2) Upper band : +2
standard deviations from the 20SMA
3) Lower band : -2
standard deviations from the 20SMA
▸As it measures volatility,
the bands will adjust accordingly to ever-changing market conditions.
▸The term standard deviation
(SD) here suggests that most of the recent price action are restrained within the upper and lower bands.
▸As the middle band uses the
SMA, the BB indicator suggests that price action tends to return to the middle of the bands.
![]()
(B) Overview
![]()
(C) Application Of BB
▸The highlights of the BB
indicator is when the three bands squeeze closer together while narrowing the moving average, it
signals that the instrument is going to experience
higher volatility ahead, thus suggesting a good chance to enter the market.
▸When the bands are wider apart
from each other, it signals that the instrument is going to experience lower volatility ahead, thus suggesting
a good chance to exit the market.
▸The upper and lower bands acts
as strong resistance and support level most of the time, as the application of SD suggests price action to
fluctuate within the two bands.
▸The middle band acts as a
breakout confirmation, where if the price actions breaks the middle band from the bottom-up its
a buy signal ; if price actions breaks from the top-down its a sell signal.
▸A breakout above or below the
upper and lower bands normally suggests a major event, or one can say an unusual market conditions. Under
this circumstances, investors are not advised to refer
these breakouts as a trading signal.
![]()

Follow Regain capital


latest articles
-
- Jun 18,2020
-
- Jun 17,2020
-
- Jun 15,2020
-
- Feb 06,2020
-
- Jan 06,2020
-
- Jan 03,2020


Risk Warning:
The trading products provided by Regain Capital include currency pairs,
precious metals, crude oil, etc., all can be considered to carry high risks. Your investment
can increase as well as decrease in value and ultimately you may lose some or all of your
deposits. Margin trading may not be suitable for everyone. Please confirm that you are fully
aware of the risks involved before trading. Please note: any information provided by Regain
Capital is not investing advice.
Top Wealth Trading Limited is registered under Canada’s Money Service Business and Topical Wealth International Limited, authorised and regulated by the Seychelles Financial Service Authority (FSA), are members of Top Wealth Group. Regain Capital is authorised by Top Wealth Group to operate under regulatory supervision in various geographical locations across the globe.


CopyRight © 2021 regaincapital.com All Rights Reserved


