


Advanced Level – MACD – Histogram

(A) Introduction
▸ In any investment trading, identifying the current momentum of an
instrument is where investors are able to make money from.
▸ One indicator that is widely used in Technical Analysis is the Moving
Average Convergence Divergence (MACD) Histogram
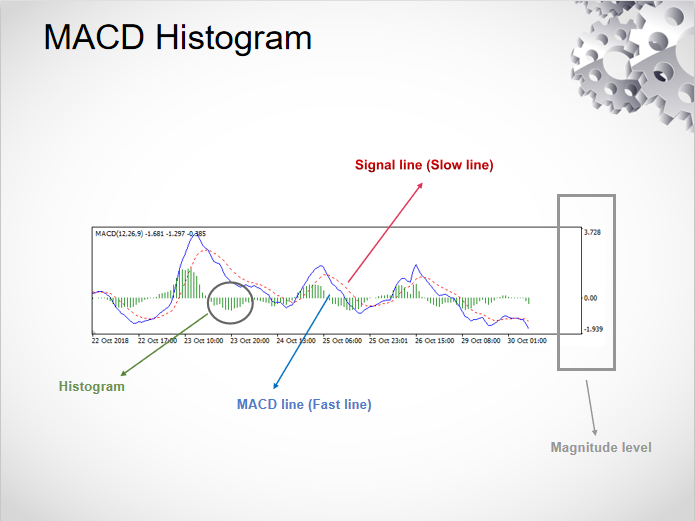
▸ In a MACD Histogram chart, there will be three numbers used for its
settings. The default settings for most charting software are 12 (Fast EMA), 26
(Slow EMA), & 9 (Signal SMA).
▸ To interpret it, the ‘12’ is the previous 12 bars of the faster moving
average; the ‘26’ is the previous 26 bars of the slower moving average; the ‘9’
is the previous 9 bars of the difference between the two moving averages.
▸ The MACD line is calculated by
subtracting the 26-period EMA from the 12-period EMA to obtain the MACD line,
while a nine-day EMA of the MACD known as the ‘signal line’ is plotted on top
of the MACD line. The
▸ Histogram provides the current
momentum of the instruments whereby if the histogram is above the 0.0 magnitude
level, the instrument is currently moving in a bullish momentum; below the 0.0
magnitude level, the instrument is moving in a bearish momentum.
▸ Similar to the Moving Average,
the MACD Histogram provides indication on a general trend of the instruments
which measures the relationship between two moving averages of an instrument
price
▸ It is a better indicator
compared to Moving Average as the MACD histogram features two signal line and
it reduces the time lag of crossovers.
▸ The indicator also provides the
current momentum (bullish/bearish) of the instruments.
(B) Uses of MACD Histogram
I)
Crossovers
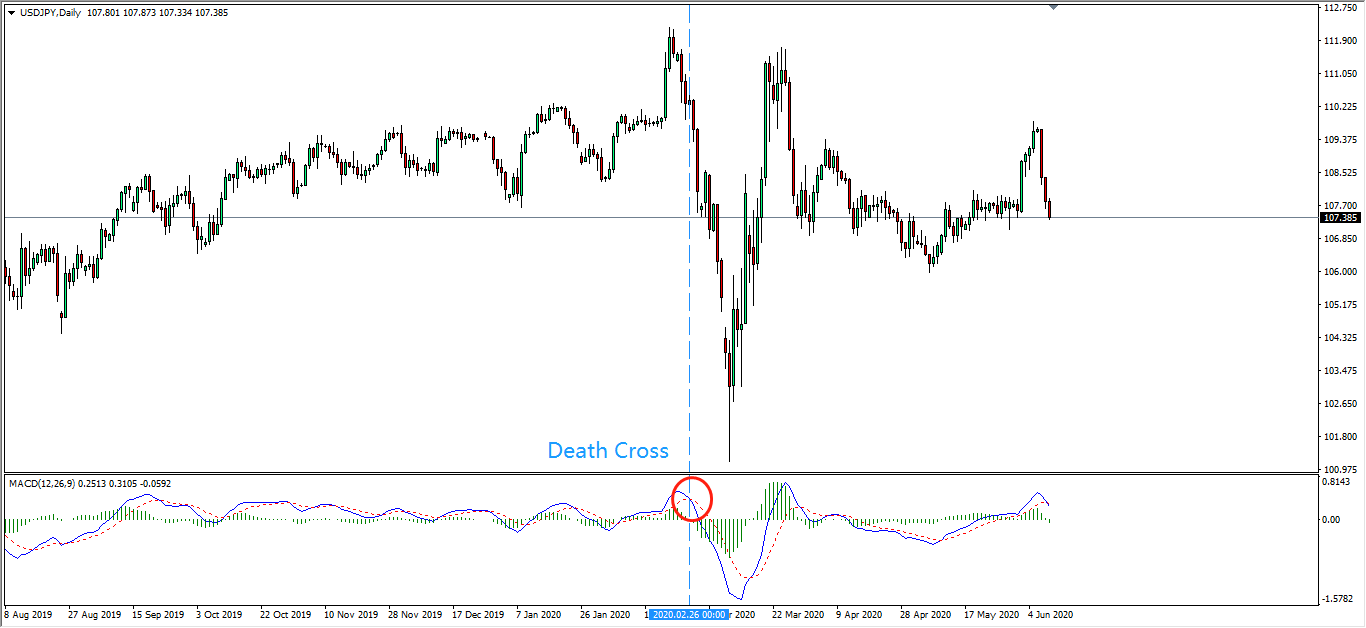
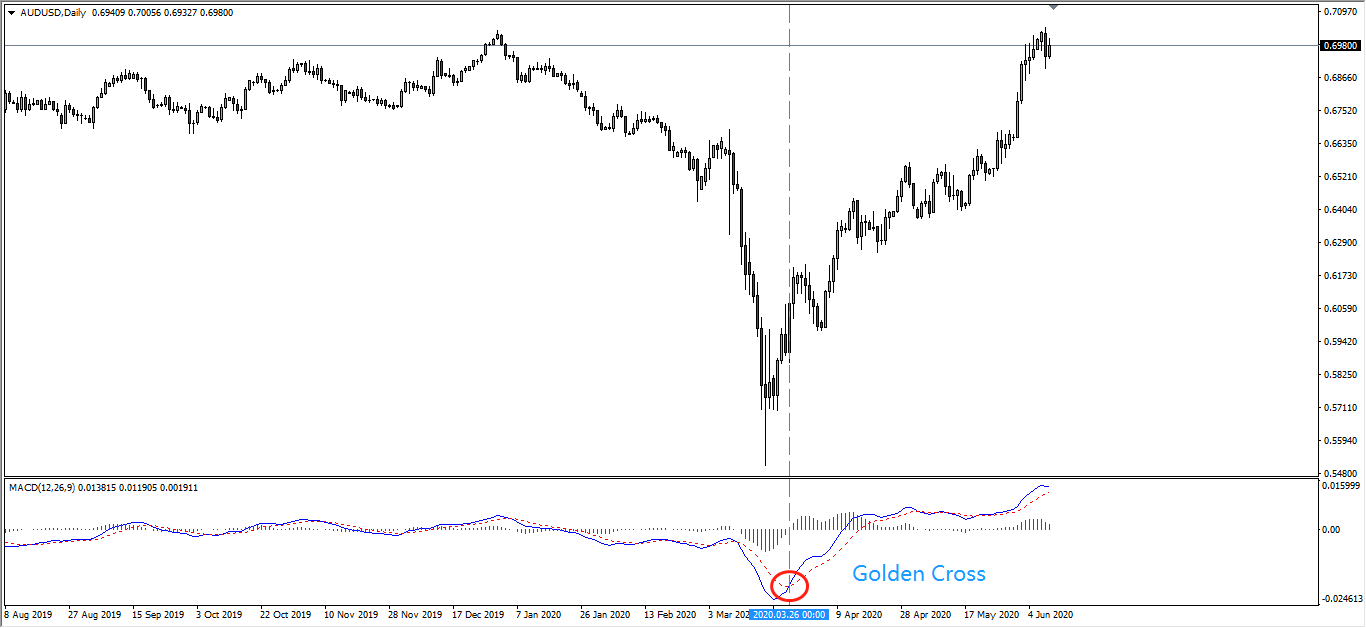
▸ Signals obtained from crossover
between the signal line and MACD line whereby if the MACD line crosses below
the signal line indicates a sell-signal (death cross); crosses above the signal
line indicates a buy-signal (golden cross).
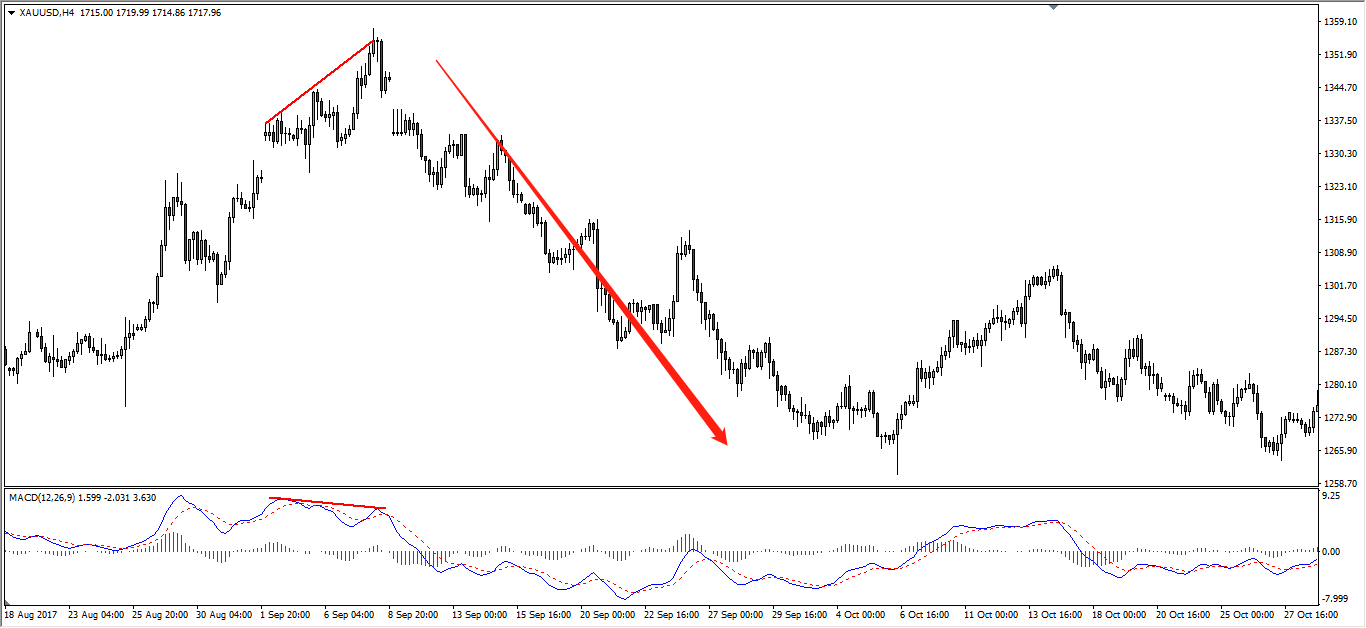
II)
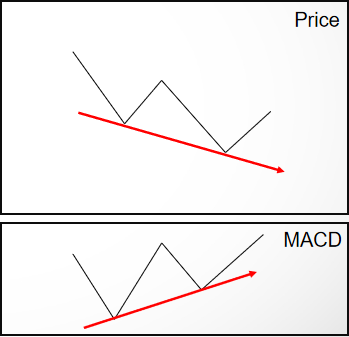
Divergence
▸ Divergence signal which
indicates differences in direction between the price action of the instruments
and the MACD indicator. Can be differentiated into Positive (Bullish) or
Negative (Bearish) divergence.
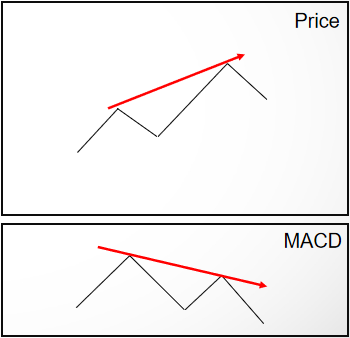
▸ A positive divergence occurs
when price action indicates persistent downtrend while the MACD indicates
persistent uptrend. This signal suggests the instrument to rebound ahead.
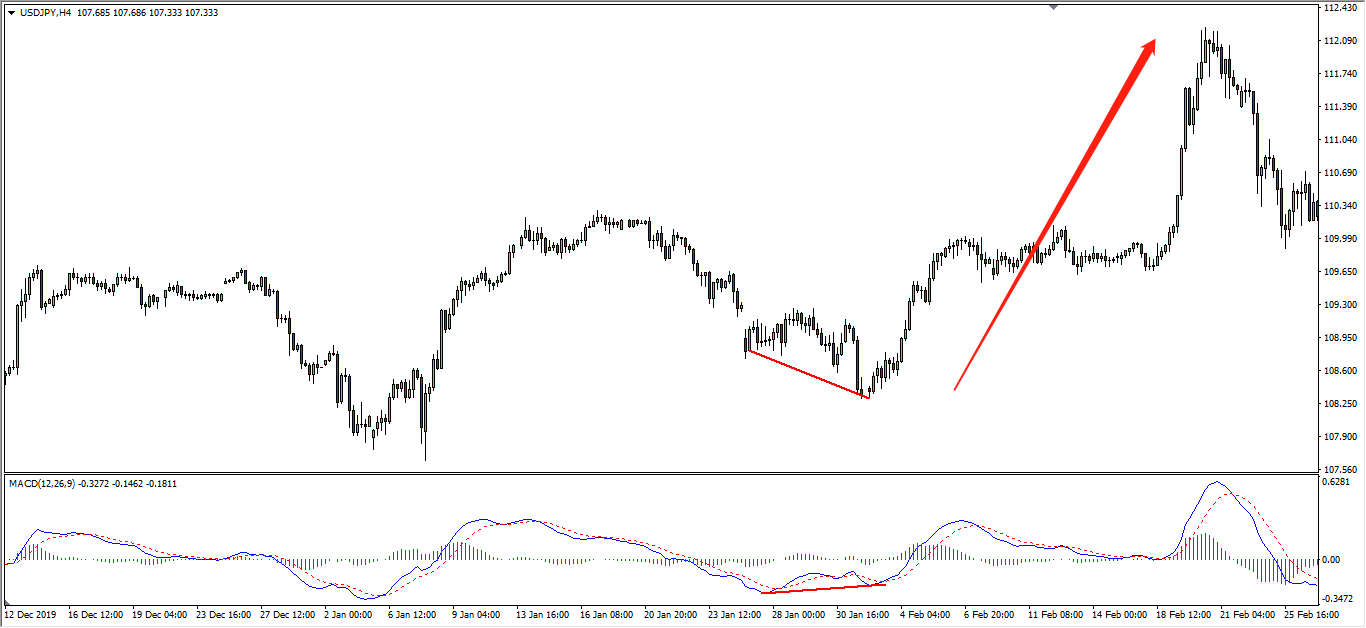
▸ A negative divergence occurs
when price action indicates persistent uptrend while the MACD indicates
persistent downtrend. This signal suggests the instrument to retrace ahead.
(C) Limitations of MACD Histogram
▸ One of the major disadvantages
for the MACD is that it is subjective to the user in terms of desired
time-frames or settings. That said, different people with different trading
patterns whom also have different settings for their MACD may acquire different
results or signals.
▸ The crossover signal is a
lagging indicator as it still takes into calculation of moving average which is
based on past price actions.
▸ The divergence signal may be
early signals as it may signal a reversal too early and causes investors to
enter the market before the price action reacts to the trend reversal.

Follow Regain capital


latest articles
-
- Jun 11,2020
-
- Jun 11,2020
-
- Feb 27,2020
-
- Feb 27,2020


Risk Warning:
The trading products provided by Regain Capital include currency pairs,
precious metals, crude oil, etc., all can be considered to carry high risks. Your investment
can increase as well as decrease in value and ultimately you may lose some or all of your
deposits. Margin trading may not be suitable for everyone. Please confirm that you are fully
aware of the risks involved before trading. Please note: any information provided by Regain
Capital is not investing advice.
Top Wealth Trading Limited is registered under Canada’s Money Service Business and Topical Wealth International Limited, authorised and regulated by the Seychelles Financial Service Authority (FSA), are members of Top Wealth Group. Regain Capital is authorised by Top Wealth Group to operate under regulatory supervision in various geographical locations across the globe.


CopyRight © 2021 regaincapital.com All Rights Reserved


