


Advanced Level – Ichimoku Kinko Hyo

Ichimoku Kinko Hyo (Ichimoku)
A) Introduction
▸ An indicator that measures or
determine 3 main things:
1) Future momentum of an
instrument’s price
2) Support &
Resistance Levels
▸ The indicator is mainly
designed for Yen (JPY) pairs. Thus this
means that it proves to be more effective on JPY pairs.
▸ In translation, Ichimoku
means ‘one glance’ , kinko means ‘equilibrium’
, while hyo means ‘chart’.
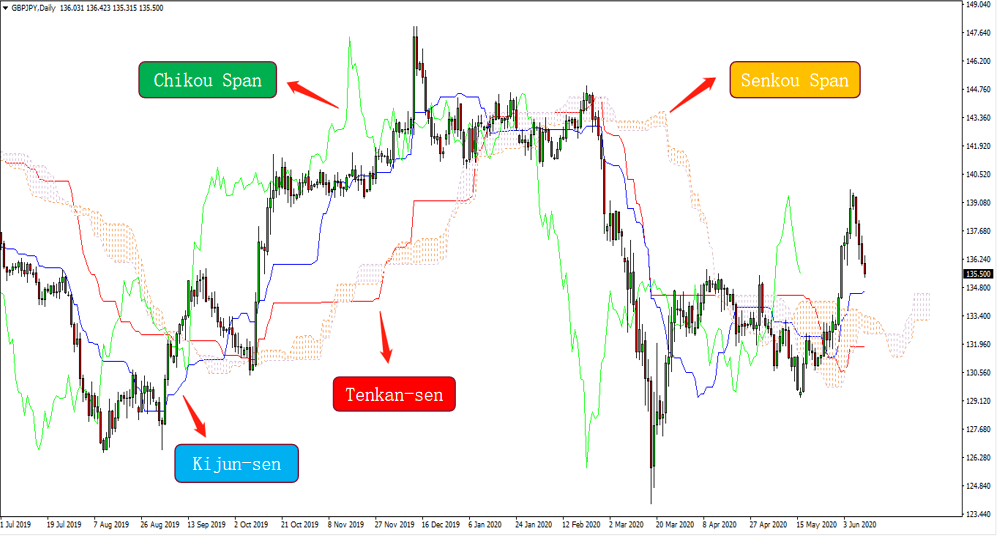
B) 5 Key Elements of Ichimoku
1) Kijun-Sen (Blue Line)
▸ Acts as an indicator of future price
movement.
▸ If the price action is above the
blue line, it has potential to climb
higher
▸ If the price action is below the
blue line, it has potential to fall
lower
▸ It is calculated by adding the highest high & lowest low for the past 26 periods and then divided by
2
(Highest
high + Lowest low)/2 for the past 26 periods
![]()
2) Tenkan-sen (Red Line)
▸ Acts as an indicator of the market trend
▸ If the red line is moving up or
down, it indicates that the market is
trending
▸ If the red line is moving
horizontally, it indicates that the
market is ranging (uncertain)
▸ It is calculated by adding the
highest high & lowest low for the
past 9 periods and then divided by 2.
(Highest high + Lowest low)/2 for
the past 9 periods
![]()
3) Senkou Span A (Cloud)
▸ Represents one of the two edges of
the cloud.
▸ Calculated by adding the tenkan-sen
& kijun-sen, dividing it by 2 and
plotted 26 periods ahead.
(Tenkan-sen + Kijun-sen)/2 plotted
26 periods ahead
![]()
4) Senkou Span B (Cloud)
▸ Represents the other edge of the cloud.
▸ Calculated by adding the
highest high & lowest low for the past 52 periods, dividing it by 2 and
plotted 26 periods ahead.
(Highest high + Lowest low)/2
for the past 52 periods and plotted 26 periods ahead
▸ Having both the Senkou Span A &
B line, we can obtain the key resistance
and support level for future price movement.
▸ If the price is above the Senkou
span, the top line represents the 1st support level while the bottom line represents
the 2nd support level.
▸ If the price is below the Senkou
span, the bottom line represents
the 1st resistance level while the top line represents the 2nd resistance level.
▸ If the price is in the middle of the
cloud, it suggests to wait for a
breakout before entering the market.
![]()
5) Chikou Span (Green Line)
▸ Acts as an signal indicator.
▸ If the line cross the price from the bottom-up direction, it is a buy signal.
▸ If the line cross the price from the top-down direction, it is a sell
signal.
▸ Calculated using today’s closing
price plotted 26 periods back on
the chart
C) Overview
D) Application Of Ichimoku
(Signal)
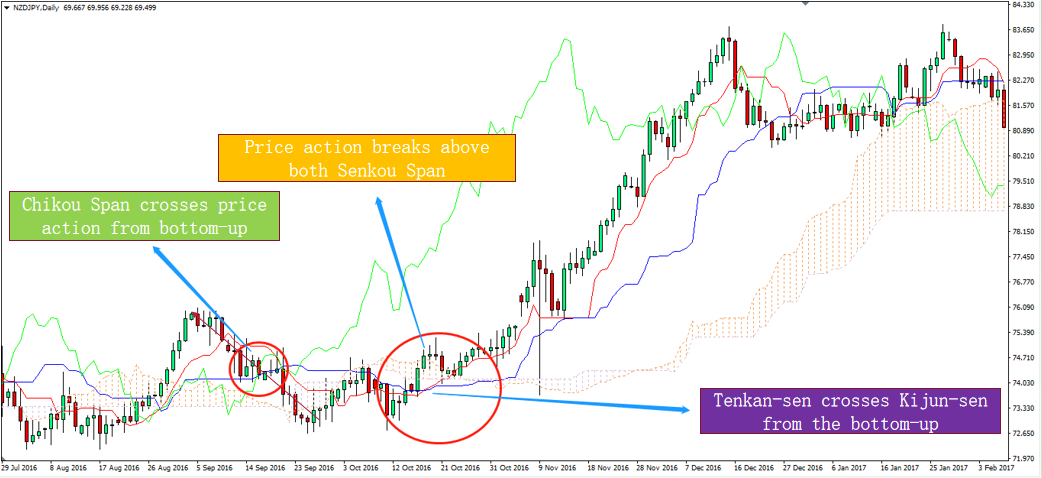
1) Buy Signal
▸ When price action breaks from the
bottom-up of both the Senkou span
(Cloud)
▸ When Tenkan-sen (red) crosses above
the Kijun-sen (blue) from the bottom-up
▸ When Chikou span (green) crosses
above the price from the bottom-up
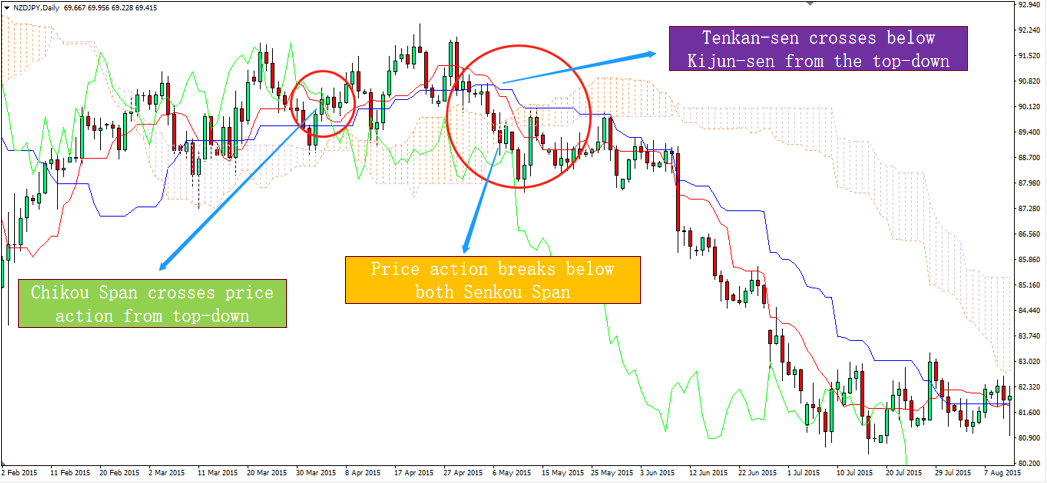
2) Sell Signal
▸ When price action breaks from the
top-down of both the Senkou span
(Cloud)
▸ When Tenkan-sen (red) crosses below
the Kijun-sen (blue) from the top-down
▸ When Chikou span (green) crosses
below the price from the top-down

Follow Regain capital


latest articles
-
- Jun 11,2020
-
- Jun 11,2020
-
- Feb 27,2020
-
- Feb 27,2020


Risk Warning:
The trading products provided by Regain Capital include currency pairs,
precious metals, crude oil, etc., all can be considered to carry high risks. Your investment
can increase as well as decrease in value and ultimately you may lose some or all of your
deposits. Margin trading may not be suitable for everyone. Please confirm that you are fully
aware of the risks involved before trading. Please note: any information provided by Regain
Capital is not investing advice.
Top Wealth Trading Limited is registered under Canada’s Money Service Business and Topical Wealth International Limited, authorised and regulated by the Seychelles Financial Service Authority (FSA), are members of Top Wealth Group. Regain Capital is authorised by Top Wealth Group to operate under regulatory supervision in various geographical locations across the globe.


CopyRight © 2021 regaincapital.com All Rights Reserved


