


Advanced – Moving Average

(A) Introduction
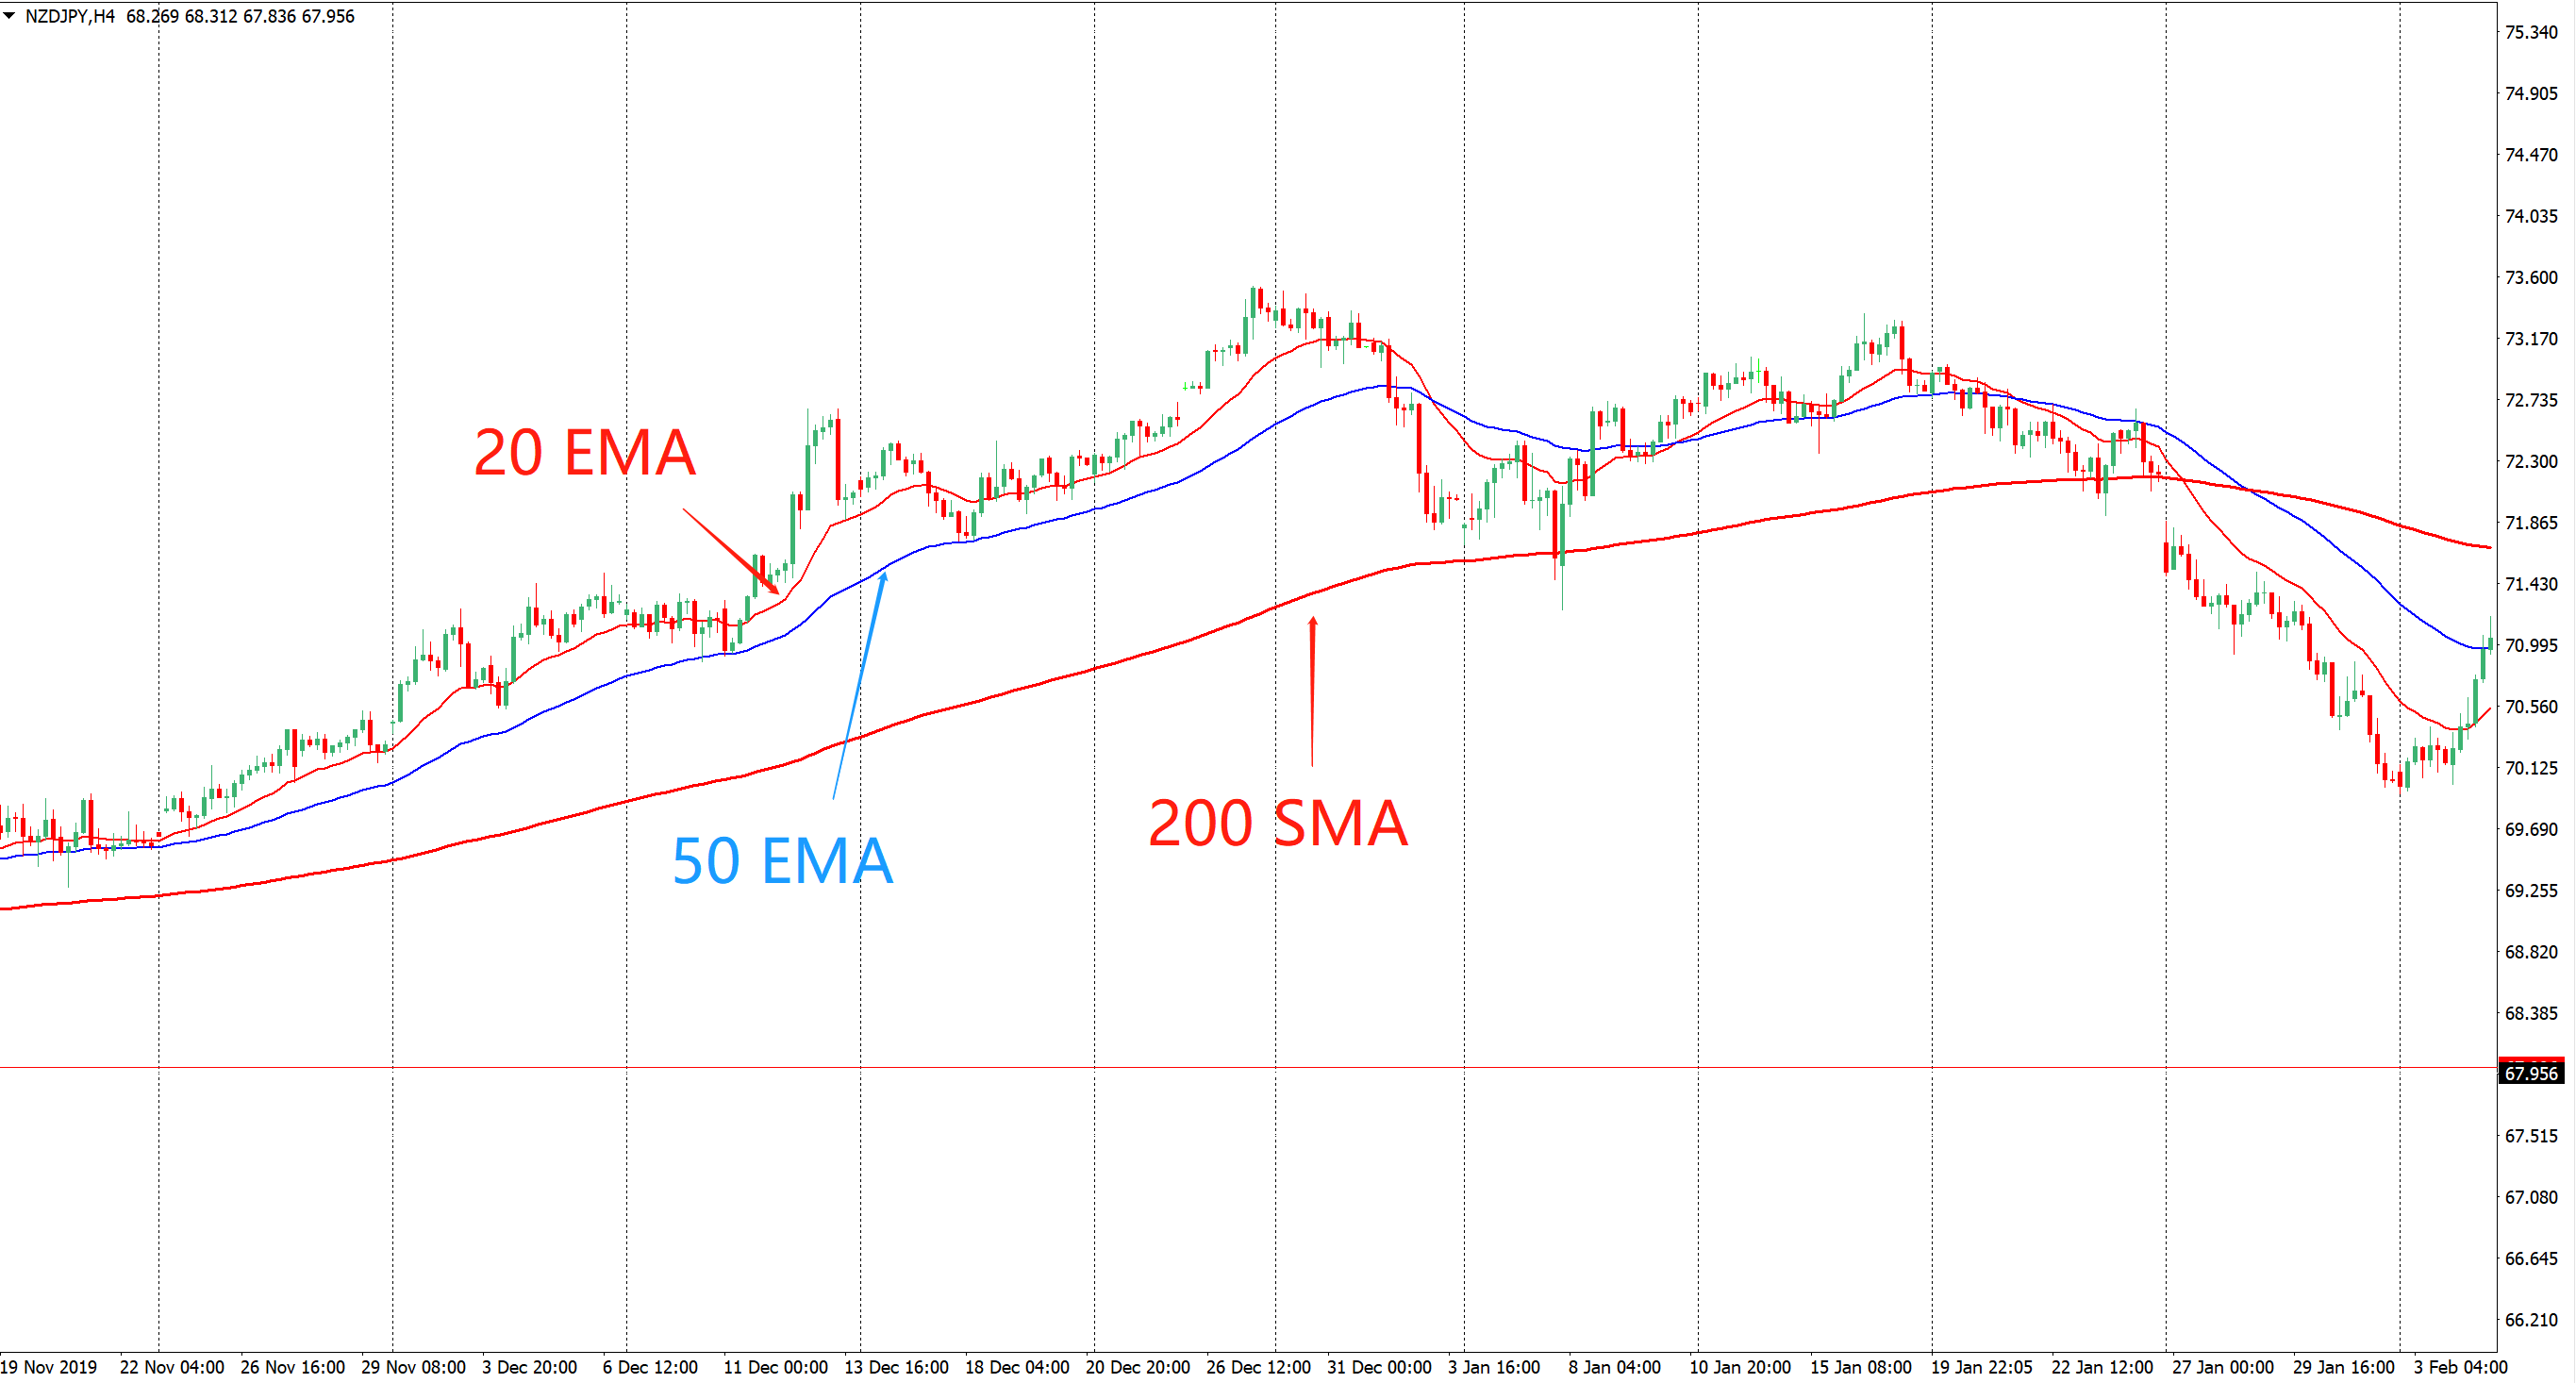
▸ One of the indicators used to smoothen out price action and obtaining the general path of recent past price movement.
▸This indicator draws a trend by calculating average of a defined number of time periods (candlestick).
▸For example, a 20-MA line is drawn by calculating the average closing price for past 20 candlesticks.
▸Investors can simply insert the desired number of average time periods according to their liking where it can vary from an average of 5 to 200 candlesticks.
▸The longer the period you use for the MA-line, the slower it reacts to the price movement (the further it is away from the price)
▸An Exponential Moving Average is different in a way that it takes into more consideration of the price actions in most recent periods than previous periods.
▸For example, a 5-MA average the movements of 5 candlesticks with the same weightages, however 5-EMA average the movements of 5 candlesticks but applies higher weightages on the 3rd, 4th & 5th candlesticks.
▸To simplify, EMA emphasis more on how traders react based more on the most recent price actions.
(B) Uses of Moving Average
▸Determine an overall trend for the instruments.
▸Obtaining signals from crossovers between 2 MA-lines whereby if the short-term MA-line crosses above the long-term MA-line (golden cross) indicates a buy signal; short-term MA-line crosses below the long-term MA-line (death cross) indicates a sell signal.
▸Can also be used as support and resistance.
(C) Limitations of Moving Average
▸A lagging indicator whereby signals from the moving average comes after the price reaction.
▸Only provide a ‘general’ trend based on past price actions.
▸Short period moving average will often have lower accuracy compared to longer period.

Follow Regain capital


latest articles
-
- Jun 11,2020
-
- Jun 11,2020
-
- Feb 27,2020
-
- Feb 27,2020


Risk Warning:
The trading products provided by Regain Capital include currency pairs,
precious metals, crude oil, etc., all can be considered to carry high risks. Your investment
can increase as well as decrease in value and ultimately you may lose some or all of your
deposits. Margin trading may not be suitable for everyone. Please confirm that you are fully
aware of the risks involved before trading. Please note: any information provided by Regain
Capital is not investing advice.
Top Wealth Trading Limited is registered under Canada’s Money Service Business and Topical Wealth International Limited, authorised and regulated by the Seychelles Financial Service Authority (FSA), are members of Top Wealth Group. Regain Capital is authorised by Top Wealth Group to operate under regulatory supervision in various geographical locations across the globe.


CopyRight © 2021 regaincapital.com All Rights Reserved


