


- Education
- Daily Market Release
- Technical Analysis
- Market News
- Market Fun & Facts
- Inspiring Quotes
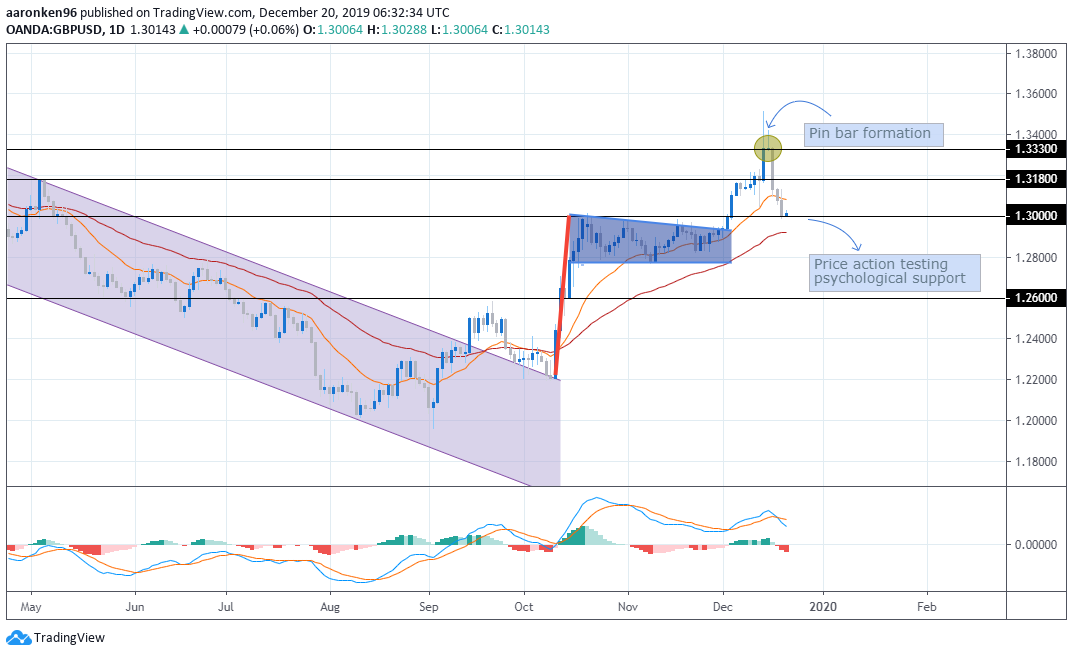
GBP/USD Evening Star Formation
Dec 20,2019
Following the previous report on GBP/USD, the pair breakout above its bullish flag formation while hitting more than a year high near 1.3500 level. However, the pair loses its upward momentum, forming an evening star below its 1.3500 level, while currently testing back the 1.3000 level. In terms of......
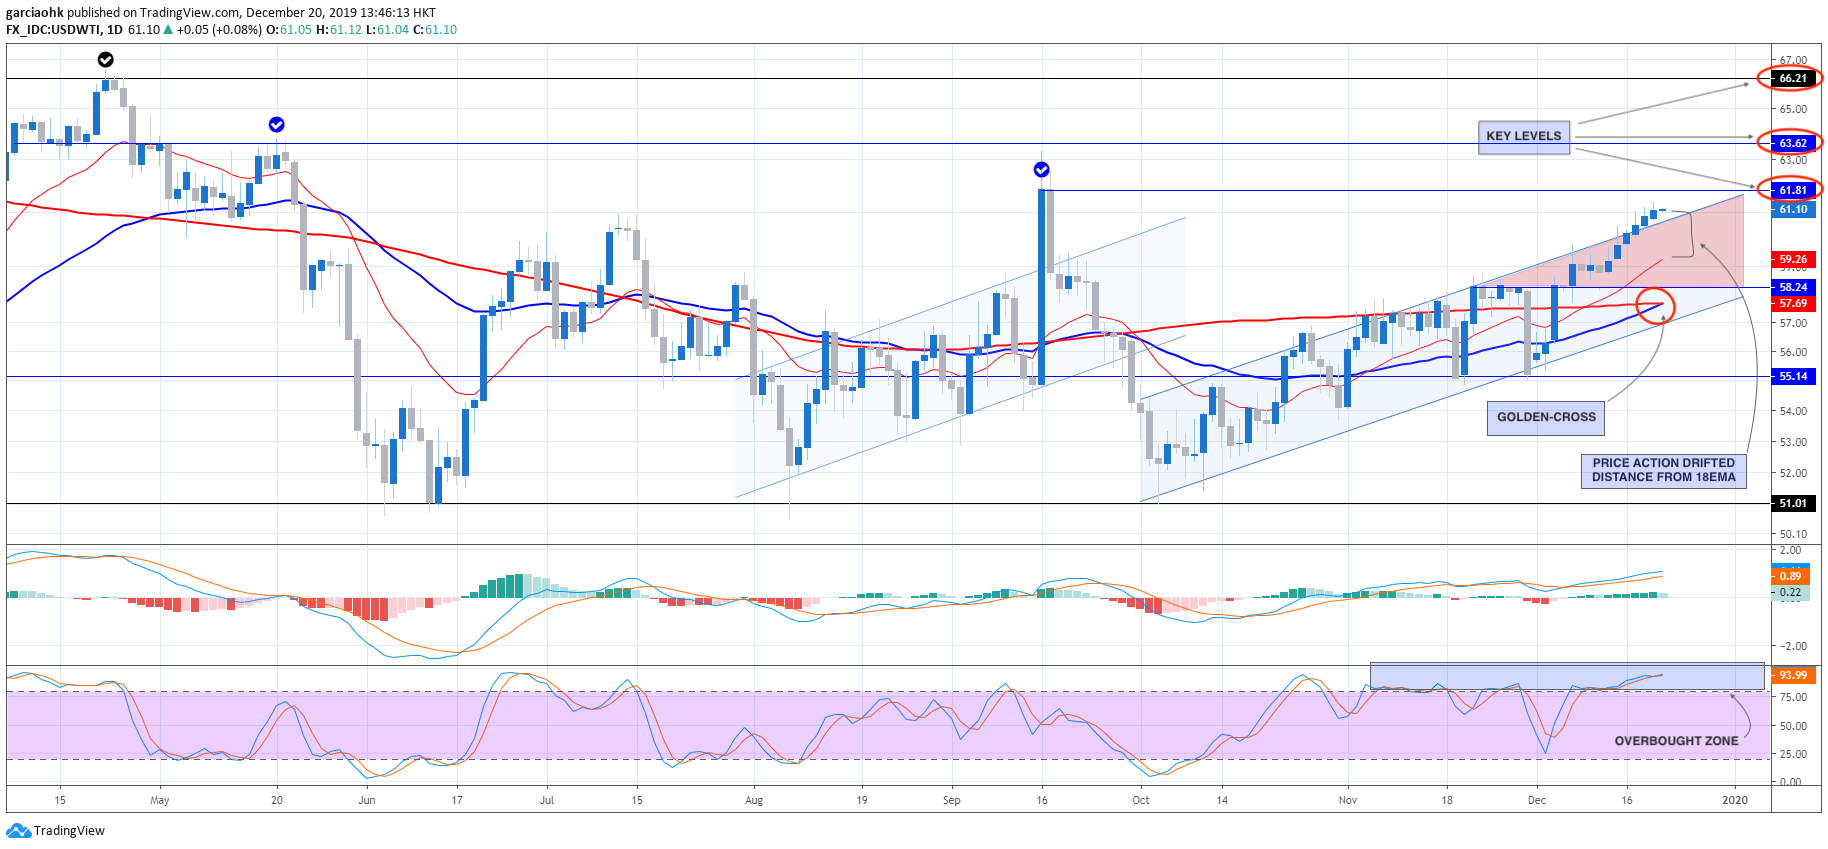
CRUDE OIL BULL ON WINNING STREAK
Dec 20,2019
After entering the triangle’s zone, the black gold was able to experience an incredible bullish momentum with six days in a row recording new highs, even breaking the ascending channel resistance and heading to three-moths high with a clear path in between. Technically speaking, price action has been recording new......
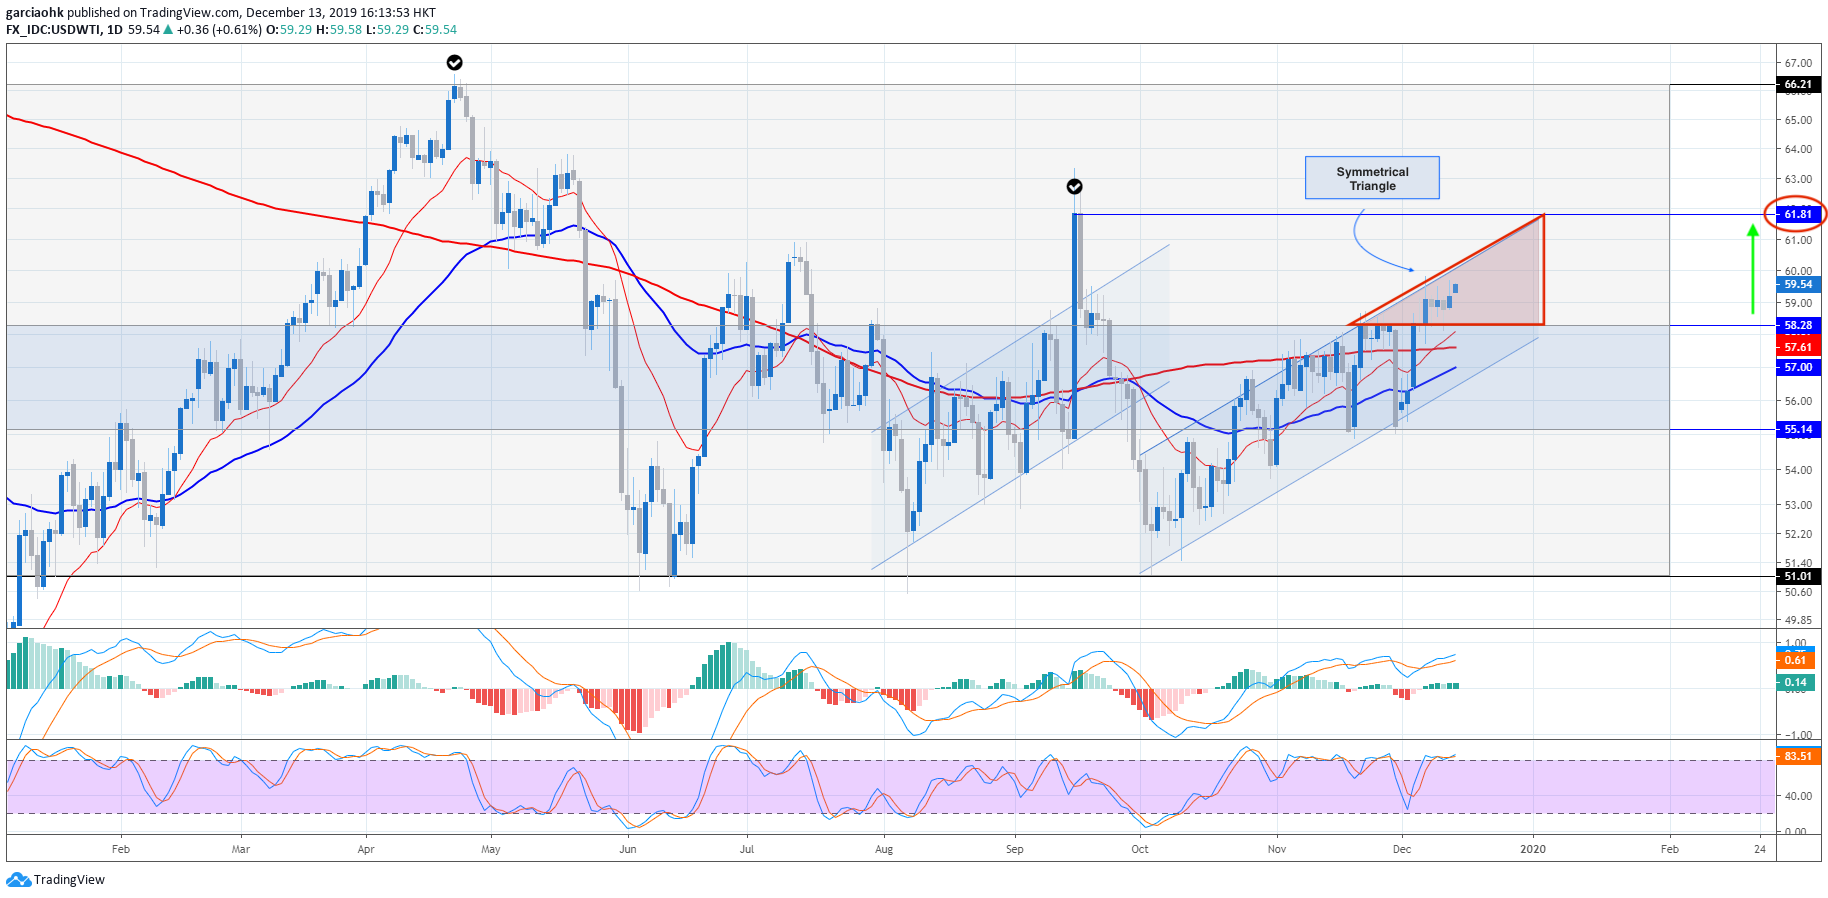
CRUDE OIL SUPPORTED ON MARKET SENTIMENT BY TARIFF CONSESSIONS
Dec 13,2019
The black commodity was able to trade high, breaking this week’s choppy price action. The market got supported by the latest and long-expected announcement from Mr. Trump signing the agreement and giving the concession to the tariff on Chinese goods. As commented last week, the price action got inside the......
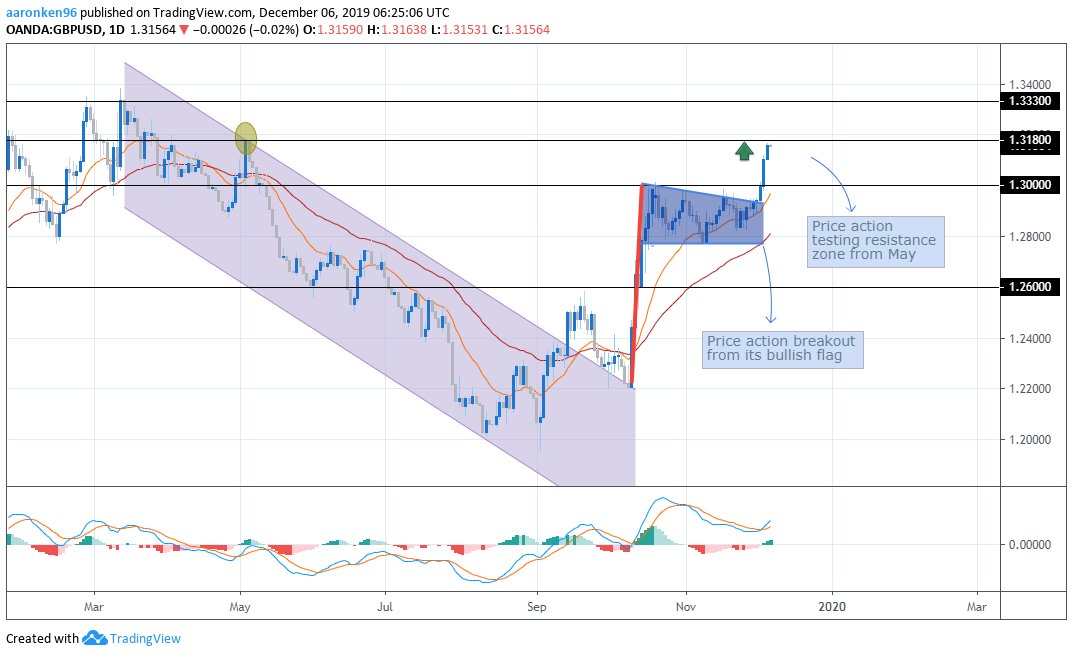
Long Awaited Bull Flag Breakout
Dec 06,2019
Following our last week’s report on GBP/USD, the pair was previously still testing near the top-level of its bullish flag. This week, market sentiment provided the catalyst needed for the pair to breakout above its bull flag and resistance zone near 1.3000. The current price action reached a 7-month high......
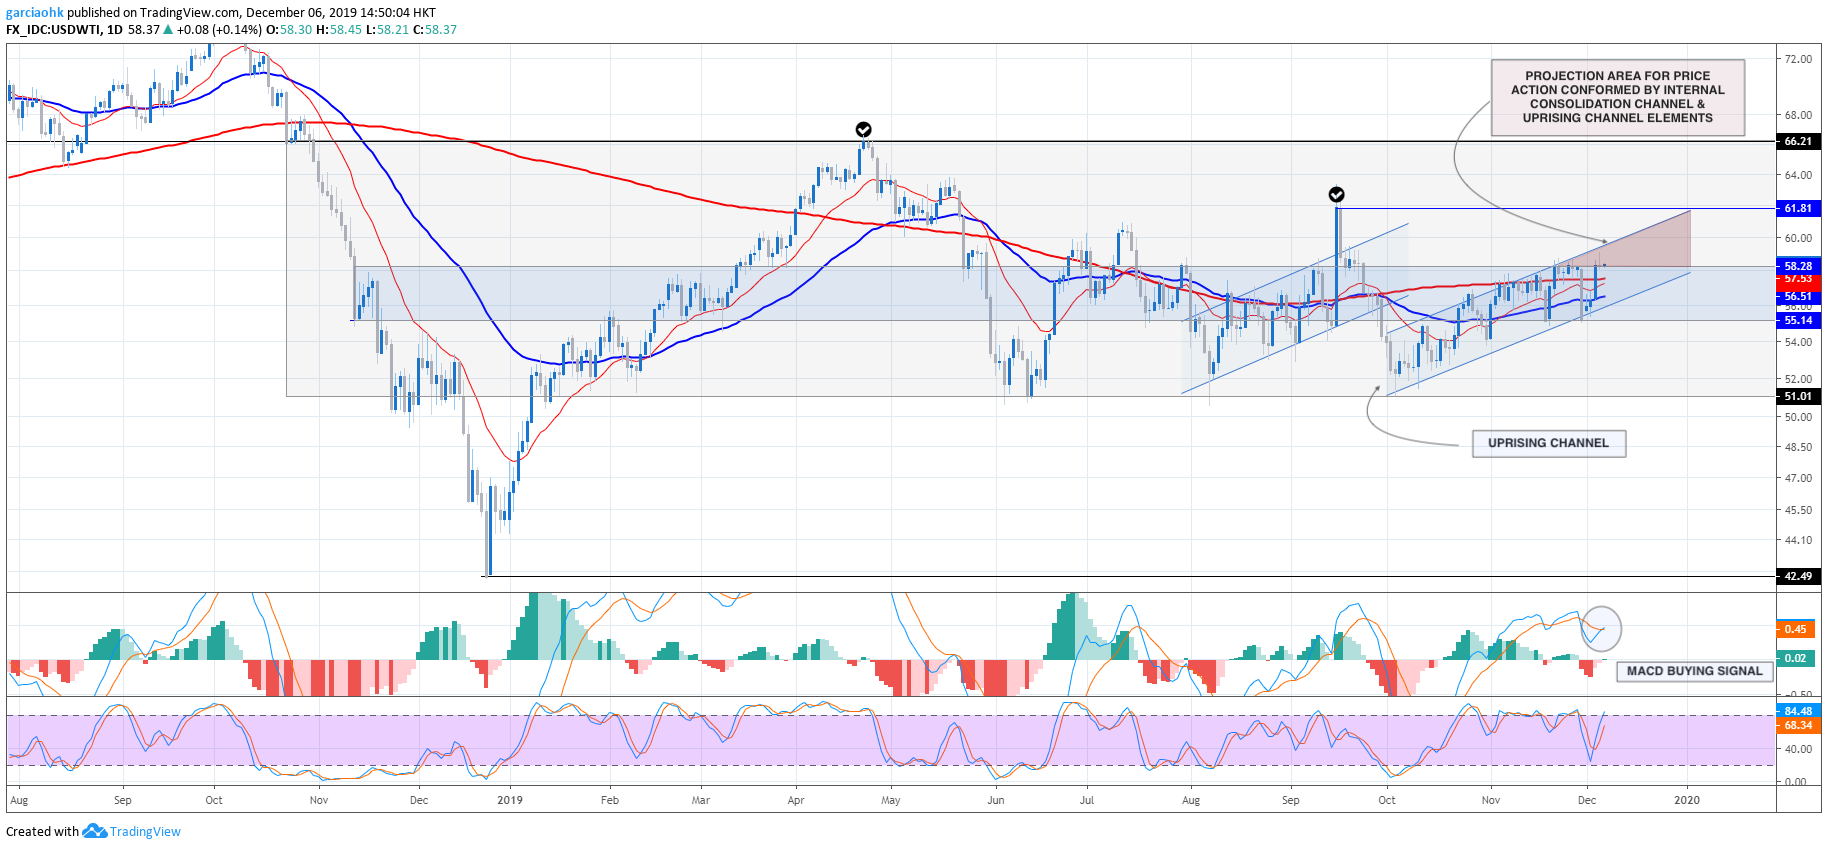
OIL MARKET REMAINS FLAT WITH CAUTIOUS INVESTORS
Dec 06,2019
Despite the Organization of the Petroleum Exporting Countries and Russia, lately known as OPEC+, agreeing to proceed with further output cuts, the market has kept in a flat note. The investors have remained cautious over the market sentiment expecting new clues from today’s meeting second episode. Before moving forward, let......
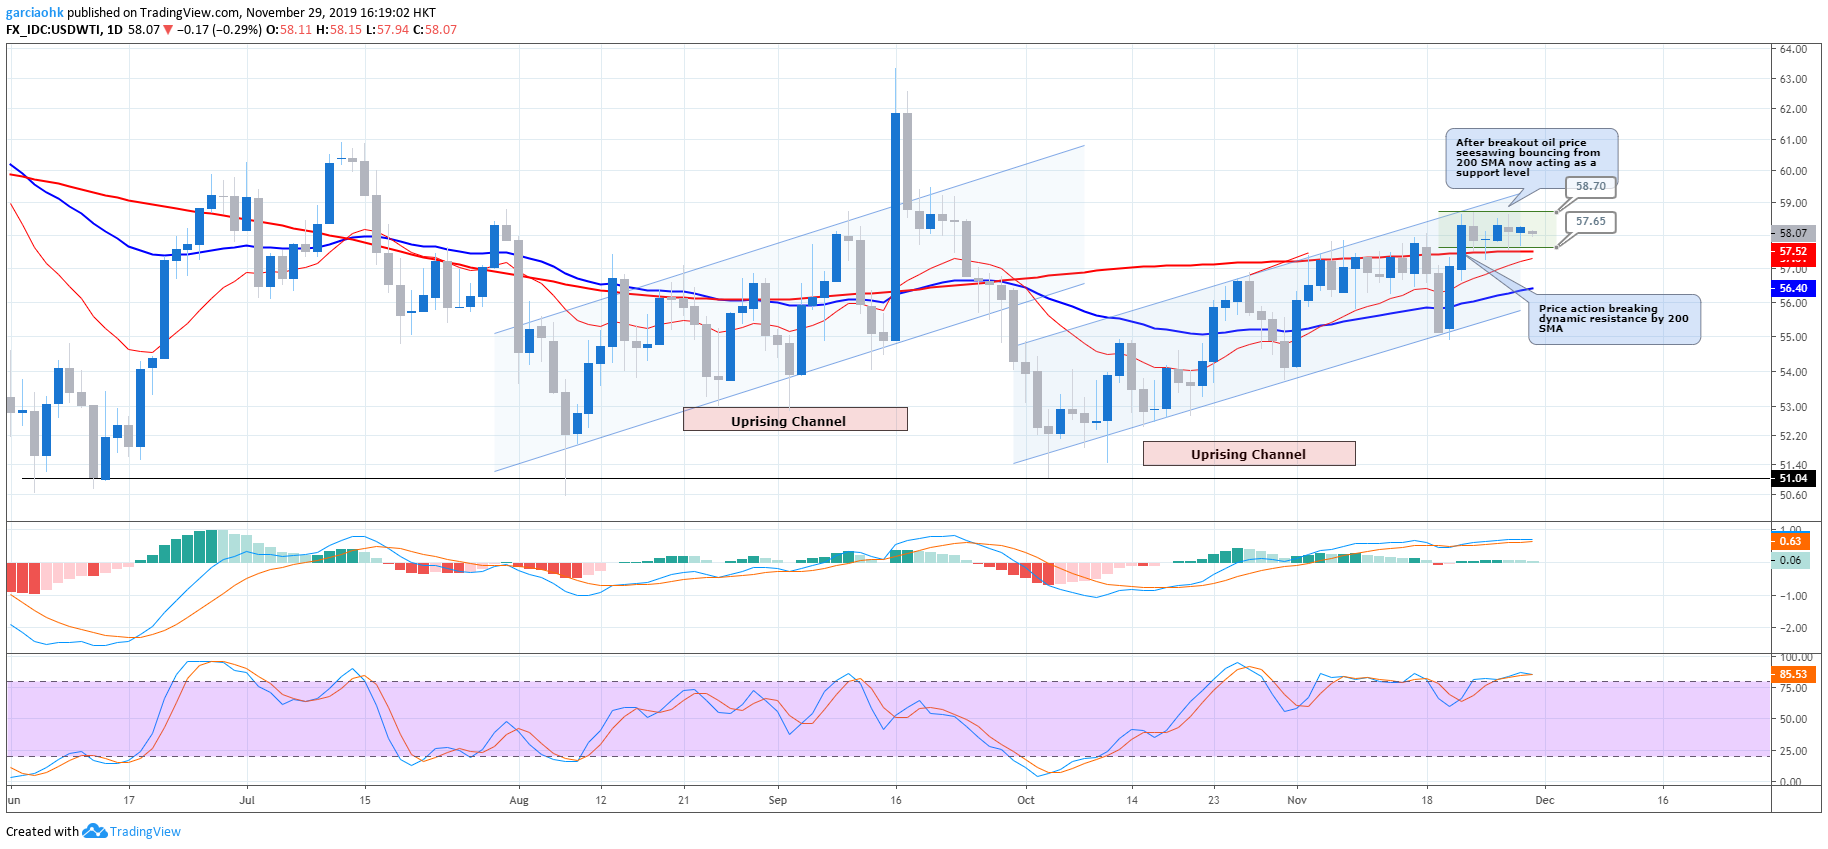
OIL MARKET SUPPORTED BY SPECULATIONS
Nov 29,2019
The oil market was able to manage and finally breakthrough after 55 days the dynamic resistance imposed by the 200 SMA. However, after this long-waited breakout, the price has been seesawing within the 58 and 57 levels, amid lack of clarity on the political front signs has diminished the market......

Follow Regain capital


latest articles
-
- Jan 24,2022

-
- Jan 17,2022

-
- Jan 14,2022
-
- Jan 13,2022
-
- Jan 12,2022
-
- Jan 11,2022


Risk Warning:
The trading products provided by Regain Capital include currency pairs,
precious metals, crude oil, etc., all can be considered to carry high risks. Your investment
can increase as well as decrease in value and ultimately you may lose some or all of your
deposits. Margin trading may not be suitable for everyone. Please confirm that you are fully
aware of the risks involved before trading. Please note: any information provided by Regain
Capital is not investing advice.
Top Wealth Trading Limited is registered under Canada’s Money Service Business and Topical Wealth International Limited, authorised and regulated by the Seychelles Financial Service Authority (FSA), are members of Top Wealth Group. Regain Capital is authorised by Top Wealth Group to operate under regulatory supervision in various geographical locations across the globe.


CopyRight © 2021 regaincapital.com All Rights Reserved


