


GBPUSD WEEKLY ANALYSIS – TECHNICAL REBOUND, BUT HOW FAR?

Market Strategist
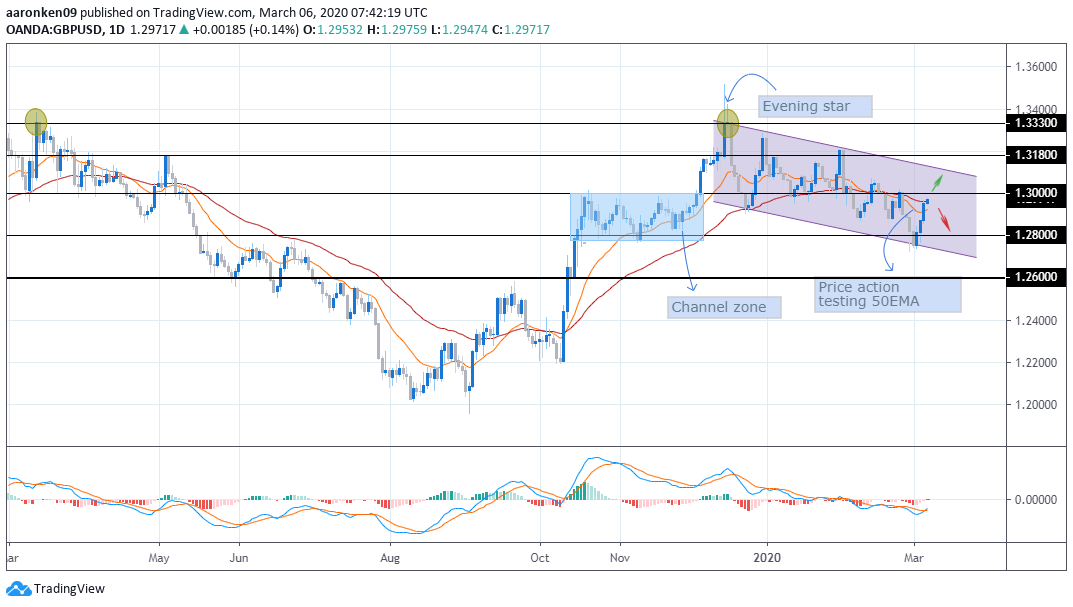
Following the previous report on GBP/USD, the pair extend losses towards the bottom-level of its falling wedge, before the recent technical rebound back towards the 1.3000 psychological resistance. Price action is also currently testing its 50EMA, where even after a breakout above the 1.3000 level, the pair still have room for further upward momentum towards the top level of the falling wedge (green arrow scenario).
–
In terms of MACD, we are able to see exhaustion in the bearish momentum, as well as the starting formation of a bullish crossover. However, without further catalyst from price action to form a higher high, the lagging indicator would easily fall back into its bearish zone, persisting its downward momentum along its falling wedge (red arrow scenario). Similar cases can be seen from previous pattern since formation of evening star in mid-December 2019.
–
From the fundamental point of view, market sentiment were mostly driven by the epidemic Covid-19 which now continues to dampen global economy outlook. Death toll continues to rise gradually outside out China, spiraling uncertainties as investors shift into safe-haven markets. Recent rally from the pair were supported by a weaker US dollar as confidence towards the US economy declined amid weaker economic data and the Covid-19 outbreak.
–
With lack of economic data from the region itself, price movement will mostly depend on the dollar index. That said, US jobs data due later today will determine the near-term trend for the pair as well as overall market sentiment. However, market participants will still keep a look-out for possible updates regarding the UK-EU trade talks.

Follow Regain capital


latest articles
-
- Jan 24,2022

-
- Jan 17,2022

-
- Jan 14,2022
-
- Jan 13,2022
-
- Jan 12,2022
-
- Jan 11,2022


Risk Warning:
The trading products provided by Regain Capital include currency pairs,
precious metals, crude oil, etc., all can be considered to carry high risks. Your investment
can increase as well as decrease in value and ultimately you may lose some or all of your
deposits. Margin trading may not be suitable for everyone. Please confirm that you are fully
aware of the risks involved before trading. Please note: any information provided by Regain
Capital is not investing advice.
Top Wealth Trading Limited is registered under Canada’s Money Service Business and Topical Wealth International Limited, authorised and regulated by the Seychelles Financial Service Authority (FSA), are members of Top Wealth Group. Regain Capital is authorised by Top Wealth Group to operate under regulatory supervision in various geographical locations across the globe.


CopyRight © 2021 regaincapital.com All Rights Reserved


